Music has always been an integral part of human culture. From ancient times to modern-day, music has evolved and transformed in various ways. With the advent of technology, music creation and discovery have taken a wild and increasingly influential new turn. Enter Generative AI – For those living under a rock, Artificial Intelligence (AI) is a technology that has revolutionized the way we do almost everything, including how we create and discover music.
@OpenAI #Jukebox (https://www.openai.com/research/jukebox)is a prime example of how AI is bridging the gap between music and future technology. #OpenAI-Jukebox “produces a wide range of music and singing styles, and generalizes to lyrics not seen during training. All the lyrics below have been co-written by a language model and OpenAI researchers” that can generate original songs and tracks in various genres and styles similar to creativity powerhouse known simply as DALL-E for image creation. It uses deep learning algorithms to analyze existing songs’ patterns and structures to create new ones.
So does the future of music creation and discovery lie in generative AI tools like OpenAI Jukebox or design and art creation in tools like DALL-E? Either way, it’s the season of all things #OpenAI. These days you can’t escape a chatGPT meme or SNL skit powered by the little chatterbox, providing endless possibilities and countless hours of entertainment for experimentation with different words, phrases, images, sounds, styles, and genres. And did I mention they can also help you to work smarter not harder with e-mail responses and documentation creation or even building apps for you ( ie – code scripting )?
Generative AI tools like OpenAI Jukebox are not only limited to creating new songs but also have the ability to remix existing ones. This opens up a whole new world of possibilities for artists who want to experiment with their work or collaborate with other musicians.
The use of generative AI tools in music creation also raises questions about copyright laws and ownership rights. As these tools become more advanced, it will be interesting to see how they impact traditional copyright laws.
As a former EDM DJ, Im excited to see where OpenAI takes its Jukebox research – it is just one example of how AI can revolutionize the world of music creation and discovery IMHO. As technology continues to evolve at this crazy rapid pace, it’s exciting to think about what other possibilities lie ahead for the world of AI and ( fill in here ). The future looks bright for humans and musicians and artists and fans alike as we march on this yellow brick journey towards what ? Emerald city or a more innovative musical landscape powered by artificial intelligence? Who knows ? Let’s ask ChatGPT!
Get the Bing app with the new AI-powered Bing now!:
https://bingapp.microsoft.com/bing?adjust=gfv2crx_717ll9t&style=sydney
CICD (DevOps) for Data Science: Part Deux
It’s been some time since I presented Part 1 of this DevOps for Data Science short anthology. Since then I have been working on scripting out this solution for a series of presentations I am doing as part of a Discovery & Insights Roadshow.
The example draws inference (pun intended) from anomaly detection and predictive maintenance scenarios since I seem spend a chunk of time working in this space. This is an implementation specifically of a Continuous Integration (CI) / Continuous Delivery (CD) pipeline in support of the applications that support those scenarios – Typically, when one is developing an AI application, two parallel motions take place:
a) A data science team is working on building out the machine learning (ML) models; often the handoff occurs when they publish out an endpoint that gets integrated into the app.
b) AppDev or developers work on the build of the application as well as are typically responsible for exposing it to end users via a web /mobile app or take the pre-trained model endpoint and call it from within an internal business process application.
The example use case for this Continuous Integration (CI)/Continuous Delivery (CD) pipeline is a fairly standard / typical Anomaly Detection and Predictive Maintenance machine learning scenario.
In short, the pipeline is designed to kick off for each new commit, run the test suite using model parameters required as input (features, eg) and tests the outputs generated (usually in the form of a score.py file) – if the test passes, the latest build branch is merged into the master which gets packaged into a Docker container and possibly Kubernetes if the operationalization or requirements demand cluster-scale support.

I have included a #Jupyter notebook for you to check out the process of deploying to @Docker and then productionalizing using @Kubernetes – Part of the latter productionalized code set includes the process for gathering data from how your users interact with your model. This is important from a retraining perspective because you need to have a closed loop architecture in order to enable said functionality.
Using Azure to Retrain Production Models Deployed Using Kubernetes
As a side note, Azure Databricks is a managed Spark offering on Azure and customers already use it for advanced analytics. It provides a collaborative Notebook based environment with CPU or GPU based compute cluster much like if not identical to the Jupyter Notebook icon above. Often, I will get asked about DevOps specifically for Databricks in addition to Azure ML so wanted to explictly reference the fact that you can use either or both.
In this section, you will find additional information on how to use Azure Machine Learning SDK with Azure Databricks. You can train a model using Spark MLlib and then deploy the model to ACI/AKS from within Azure Databricks just like the example above. In additionn, you can also use Automated ML capability (public preview) of Azure ML SDK with Azure Databricks or without. A natural cloud convergence between ML/AI service offerings is currently underway across all vendors. This enables things like:
- Customers who use Azure Databricks for advanced analytics can now use the same cluster to run experiments with or without automated machine learning.
- You can keep the data within the same cluster.
- You can leverage the local worker nodes with autoscale and auto termination capabilities.
- You can use multiple cores of your Azure Databricks cluster to perform simultenous training.
- You can further tune the model generated by automated machine learning if you chose to.
- Every run (including the best run) is available as a pipeline, which you can tune further if needed.
- The model trained using Azure Databricks can be registered in Azure ML SDK workspace and then deployed to Azure managed compute (ACI or AKS) using the Azure Machine learning SDK.
Explaining #Containers / #Kubernetes to a Child : How To Become a Storytelling Steward Using Gamification & Graphic Novels (Comics)
How To Become a Storytelling Steward Using Gamification & Graphic Novels (Comics)
If someone asked you to explain the benefits of #Containers / #Kubernetes as though you were speaking to a child, do it in under 2 minutes & guarantee said kiddo’s comprehension, could you do it?
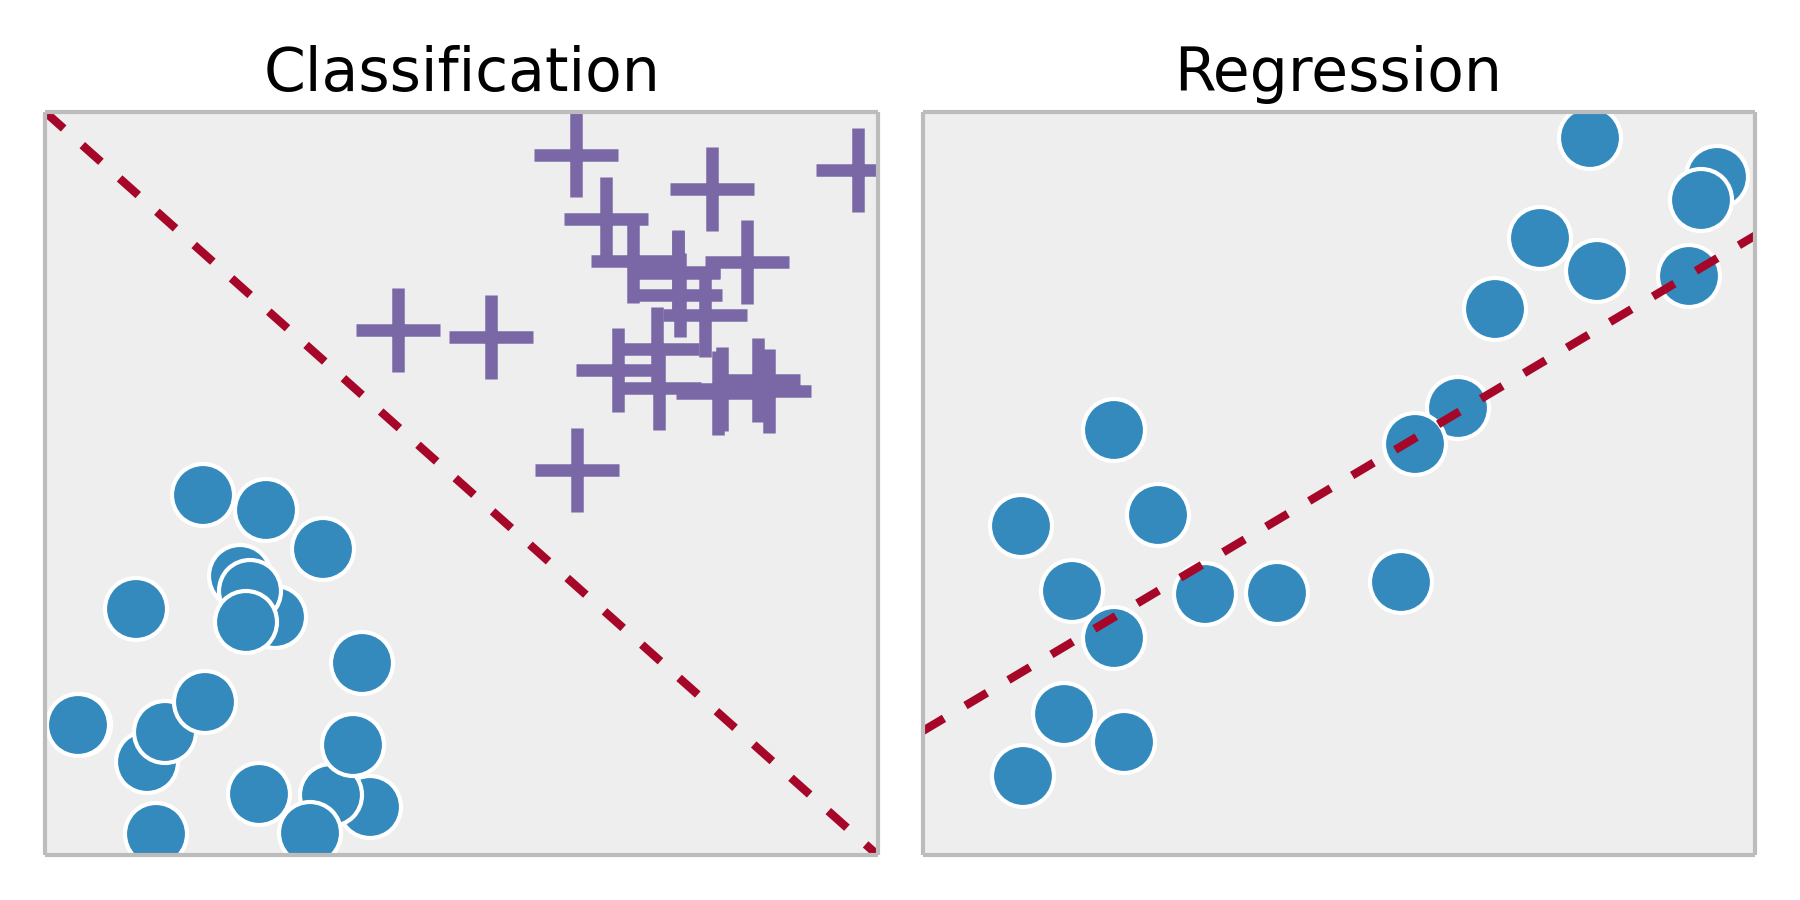
I was tasked recently with doing the same thing by my COO using Machine Learning as the main talking point . To elucidate, I decided to pose the same question to several peers who graciously entertained this whim ‘o mine. While they provided technically correct explanations’, often, they parked their response somewhere between boredom-block and theoretical thoroughfare. Yawn!
What those very intelligent practitioners failed to remember was this was NOT the latest round of stump-the-chump; that the goal was to explain Machine Learning in a way that a child could grok without “adult-splaining” / “grownup-eze” or other explanatory methods – Add to this, the goal of keeping the child engaged for the full 2 minutes –> well, shoot, ++ to you, dear reader turned supreme storytelling savant if you made that happen. While we are at it, why not add the ability to explain ML while avoiding the dreaded “eye gloss over” affect that most listeners dawn when tuning out their brain. This ‘Charlie Brown’ <whoah whoah whoah> adult vernacular riposte is nearly always reflected back to the speaker via those truth telling eyes of yours, enabling the Edgar Allen Poe in us all. Huh? What I mean is the tell-tale Pavlovian heart response to any “Data Science-based” summarization, in my experience.
Instead, I described two scenarios involving exotic fruit –> the 1st, included the name for each of those curious fruits aka labels which was the basis for her being able to label them on demand accordingly. The 2nd scenario, also involved exotic fruits BUT the difference was that she was NOT provided any names ahead of time yet still was tasked with naming said items – And for those data scientists reading this, naturally, were metaphors for supervised and unsupervised learning.
Originally, I had prepared a similar talk for a ML centric presentation I was set to give to a community based data science event (later shared on this blog) – It contains about 90% comics / image iconography instead of laborious text per slide & was received incredibly well. In fact, when delivered to a 200+ audience, it was met with much applause and higher than normal attendee survey satisfaction scores. Simplicity & pacing; Remember, an image speaks 1000 words and to a child who often learns experientially / visually, well, it becomes the storytellers handbook to the hive mind of children everywhere :).
By the way, you can stop me next time when I diverge so sharply from the path.
But now we are back –> putting to bed my thorough digression & pulling you back to my 1st sentence above:
If someone asked you to explain the benefits of #Containers / #Kubernetes as though you were speaking to a child, do it in under 2 minutes & guarantee said kiddo’s comprehension, could you do it?
This awesome comic/bedtime story is one way to answer with a resounding YES ! Meet Phippy & Zee and follow their adventures as they head off to the Zoo: Phippy Goes To The Zoo_A_Kubernetes_Story: https://azure.microsoft.com/en-us/resources/phippy-goes-to-the-zoo/en-us/
DevOps for Data Science – Part 1: ML Containers Becoming an Ops Friendly Citizen
So, for the longest time, I was in the typical Data Scientist mind space (or at least, what I personally thought was ‘typical’) when it came to CI/CD for my data science project implementations –> DevOps was for engineering / app dev projects; or lift and shift/Infrastructure projects. Not for the work I did – right? Dev vs. IT (DevOps) seemed to battle on while we Data Scientists quietly pursued or end results outside of this traditional argument:
At the same time, the rise & subsequent domination of K8 (Kubernetes) and Docker et al <containerization> was the 1st introduction I had to DevOps for Data Science. And, in the beginning, I didn’t get it, if I am being honest. Frankly, I didn’t really get the allure of containers <that was my ignorance>. When most data scientists start working, they realize that the majority of data science work involve getting data into the format needed for the model to use. Even beyond that, the model being developed will need to be operationalized as part of some type of web/mobile/custom application for the end user.
Now most of us data scientists have the minimum required / viable processes to handle things like versioning / source control et al. Most of us have our model versions controlled on Git. But is that enough?
It was during an Image Recognition workshop that I was running for a customer that required several specific image pre-processing & deep learning libraries in order to effectively script out an end to end / complete image recognition + object detection solution – In the end, it was scripted using Keras on Tensorflow (on Azure) using the CoCo Stuff 2018 dataset + YOLO real-time object detection that I augmented with additional images/labels specific to my use case & industry (aka ‘Active Learning’):
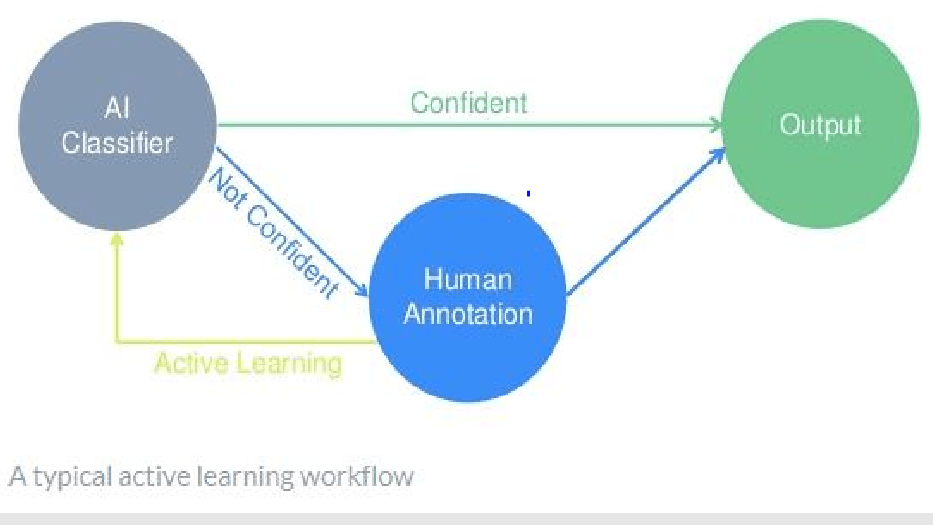
- Active Learning Workflow
Active Learning is an example of semi-supervised learning in which an algorithm interactively asks for more labeled data in order to affect model performance positively.
Labeling is often rushed because it doesn’t carry the cache of other steps in the typical data science workflow – And getting the data preprocessed (in this case , Images and Labels) is a necessary evil if you want to achieve better model performance in terms of accuracy, precision, recall, F1 – whichever, given a specific algorithm in play & its associated model evaluation metric(s) :
And it was during the setup/installation of these libraries when it occurred to me so clearly the benefit of Data Science containerization – If you have always scripted locally or on a VM, you will understand the pain of maintaining library / package versions whether using python or R or Julia or whatever the language du jour you use to script your model parameters / methods etc.
And when version conflicts come into play, you know how much time gets wasted searching / Googling / Stack Overflowing a solution for a resolution (ooh, those version dependency error messages are my FAVE <not really, sigh…but I digress>…
Even when you use Anaconda or miniconda “conda” for environment management, you are cooking with gas until you are not: like when your project requirements demand you pip/conda install very rare/specific libraries/packages that have other pkg version dependencies / prerequisites only to hit an error during the last package install step advising that some other upstream pkg version that is required is incorrect / outdated thus causing your whole install to roll back. Fun times <and this is why Cloud infrastructure experts exist>; but it takes away from what Data Scientists are chartered with doing when working on a ML/DL project. <Sad but true: Most Data Scientists will understand / commiserate what I am describing as a necessary evil in today’s day and age.>
OK and now we are back: Enter containers – how simple is it to have a Dockerfile (for example) which contains all the commands a user could call via the CLI to assemble an image including all of the packages/libraries and their dependencies by version for a set python kernel <2 or 3> and version (2.6, 2.7, 3.4, 3.5, 3.6 etc ) for this specific project that I described above? Technically speaking, Docker can build images automatically by reading the instructions from this Dockerfile. Further, using docker, build users can create an automated build that executes several command-line instructions in succession. –> Right there, DevOps comes clearly into picture where the benefits of environment management (for starters) and the subsequent time savings / headache avoidance becomes greater than the learning curve for this potentially new concept.
There are some other points to note to make this happen in the real world: Something like VSTS would need to be wrapped into a Docker Image, which would then be put on a Docker container registry on a cloud provider like Azure. Once on the registry, it would be orchestrated using Kubernetes.
Right about now, your mind is wanting to completely shut down. Most data scientists know how to provide a CSV file with predictions / or a scoring web service centered on image recognition/ classification handed off to a member of your AppDev team to integrate / code into an existing app.
However, what about versioning / controlling the model version ? Each time you hyper tune parameters within a model you are potentially changing the model performance – How do you know which set of ‘tunes’ resulted in the highest evaluation post scoring? I think about this all of the time because even if you save your changes in distinct notebooks (using JupyterHub et al), you have to be very prescriptive on your naming conventions to reflect the changes made to compare side by side across all changes during each tuning session you conduct.
This doesn’t even take into account once you pick the best performing model, actually implementing version control for the model that has been operationalized in production and the subsequent code changes required to consume it via some business app/process. How does the typical end user interact with the operationalized scoring system once introduced to them via the app? How will it scale!? All this would involve confidence testing, checking against a set threshold, and triggering some type of closed loop action system when anomalies are detected. Plus, how do you get sign off from different parties and orchestration between different cloud & on-premise servers that support the business process (with all the corporate firewall / networking / data movement / storage / encryption requirements & rules)? Maybe you have others to think about this – But if you want to be a data scientist worth having the overly used moniker applied to your role, you should care enough to learn about DevOps and how you can be a better corporate citizen & not just the Rockstar Data Scientist who alienates everyone to get to the root cause. IMHO:
This should be part of your Data Scientist process. Period. Hard stop. Not only for you, but for others that come after you or are on your team. No need to reinvent the wheel-Plus, for organizations that have strict CI/CD / DevOps procedures and limited Ops staff, the automation that you can bring with your project deliverables will win you favor, at a minimum, for considering this vital aspect to all other appDev type projects / roles in your company.
Integrating Databricks with Azure DW, Cosmos DB & Azure SQL (part 1 of 2)
I tweeted a data flow earlier today that walks through an end-to-end ML scenario using the new Databricks on Azure service (currently in preview). It also includes the orchestration pattern for ETL (populating tables, transforming data, loading into Azure DW etc), as well as the SparkML model creation stored on CosmosDB along with the recommendations output. Here is a refresher:
Some n uances that are really helpful to understand: Reading data in as CSV but writing results as parquet. This parquet file is then the input for populating a SQL DB table as well as the normalized DIM table in SQL DW both by the same name.
Selecting the latest Databricks on Azure version (4.0 version as of 2/10/18).
Using #ADLS (DataLake Storage , my pref) &/or blob.
Azure #ADFv2 (Data Factory v2) makes it incredibly easy to orchestrate the data movement from 3rd party clouds like S3 or on-premise data sources in a hybrid scenario to Azure with the scheduling / tumbling one needs for effective data pipelines in the cloud.
I love how easy it is to connect BI tools as well. Power BI Desktop can connect to any ODBC data source and specifically to your Databricks clusters by using the Databricks ODBC driver. Power BI Service is a fully managed web application running in Azure. As of November 2017, it only supports Spark running on HDInsight. However, you can create a report using Power BI Desktop and upload it to an Azure service.
The next post will cover using @databricks on @Azure with #Event Hubs !
Learning From the Pang of Quantitative Defeat
…@NFLFantasy #PPR Matchup failure, that is.
Let me preface this by saying that immediately after drafting my team, a manic flurry of clicks & non-favorable sighs – I measured my lineup for week 0 & beyond in terms of likelihood to win the playoffs. And I came in last (discussed in a previous post).
My win/loss season ratio prediction ala @NFLFantasy was terrible (regular season = 6wins:8losses. (Ouch)…Luckily, I troll the waiver wire and pluck unknowns before they become titans (Kareem Hunt, Alvin Kamara to name a few from this season), or slot in weekly bosses before the mainstream agree they should be added to some Deep Sleeper Waiver Report. It is what has propelled me since Year 1. It is what I am most proud about in terms of my algorithms fantasy predictions. And emotion aside, statistically, after 4 years of training, I can attest to it’s success in terms of accurate machine predictability season after season, week after week.
Because of this trolling, I am now projected to be #1 again in the League with either a 10:4 or 9:5 ratio.
Why that is important is I lost 4 games in a row and forgot this little fact above. I mean I was undefeated for the first 5 weeks. So, having 4 straight back to back losses hurt and I went underground to lick my wounds. Until I was reminded that I was always going to have a minimum of 4 losses . And even if they were back-to-back, perhaps. they are now out of the way (unless the 9:5 ratio comes true). In either case, I am slotted to take back my #1 league bragging rites as we move into playoffs. 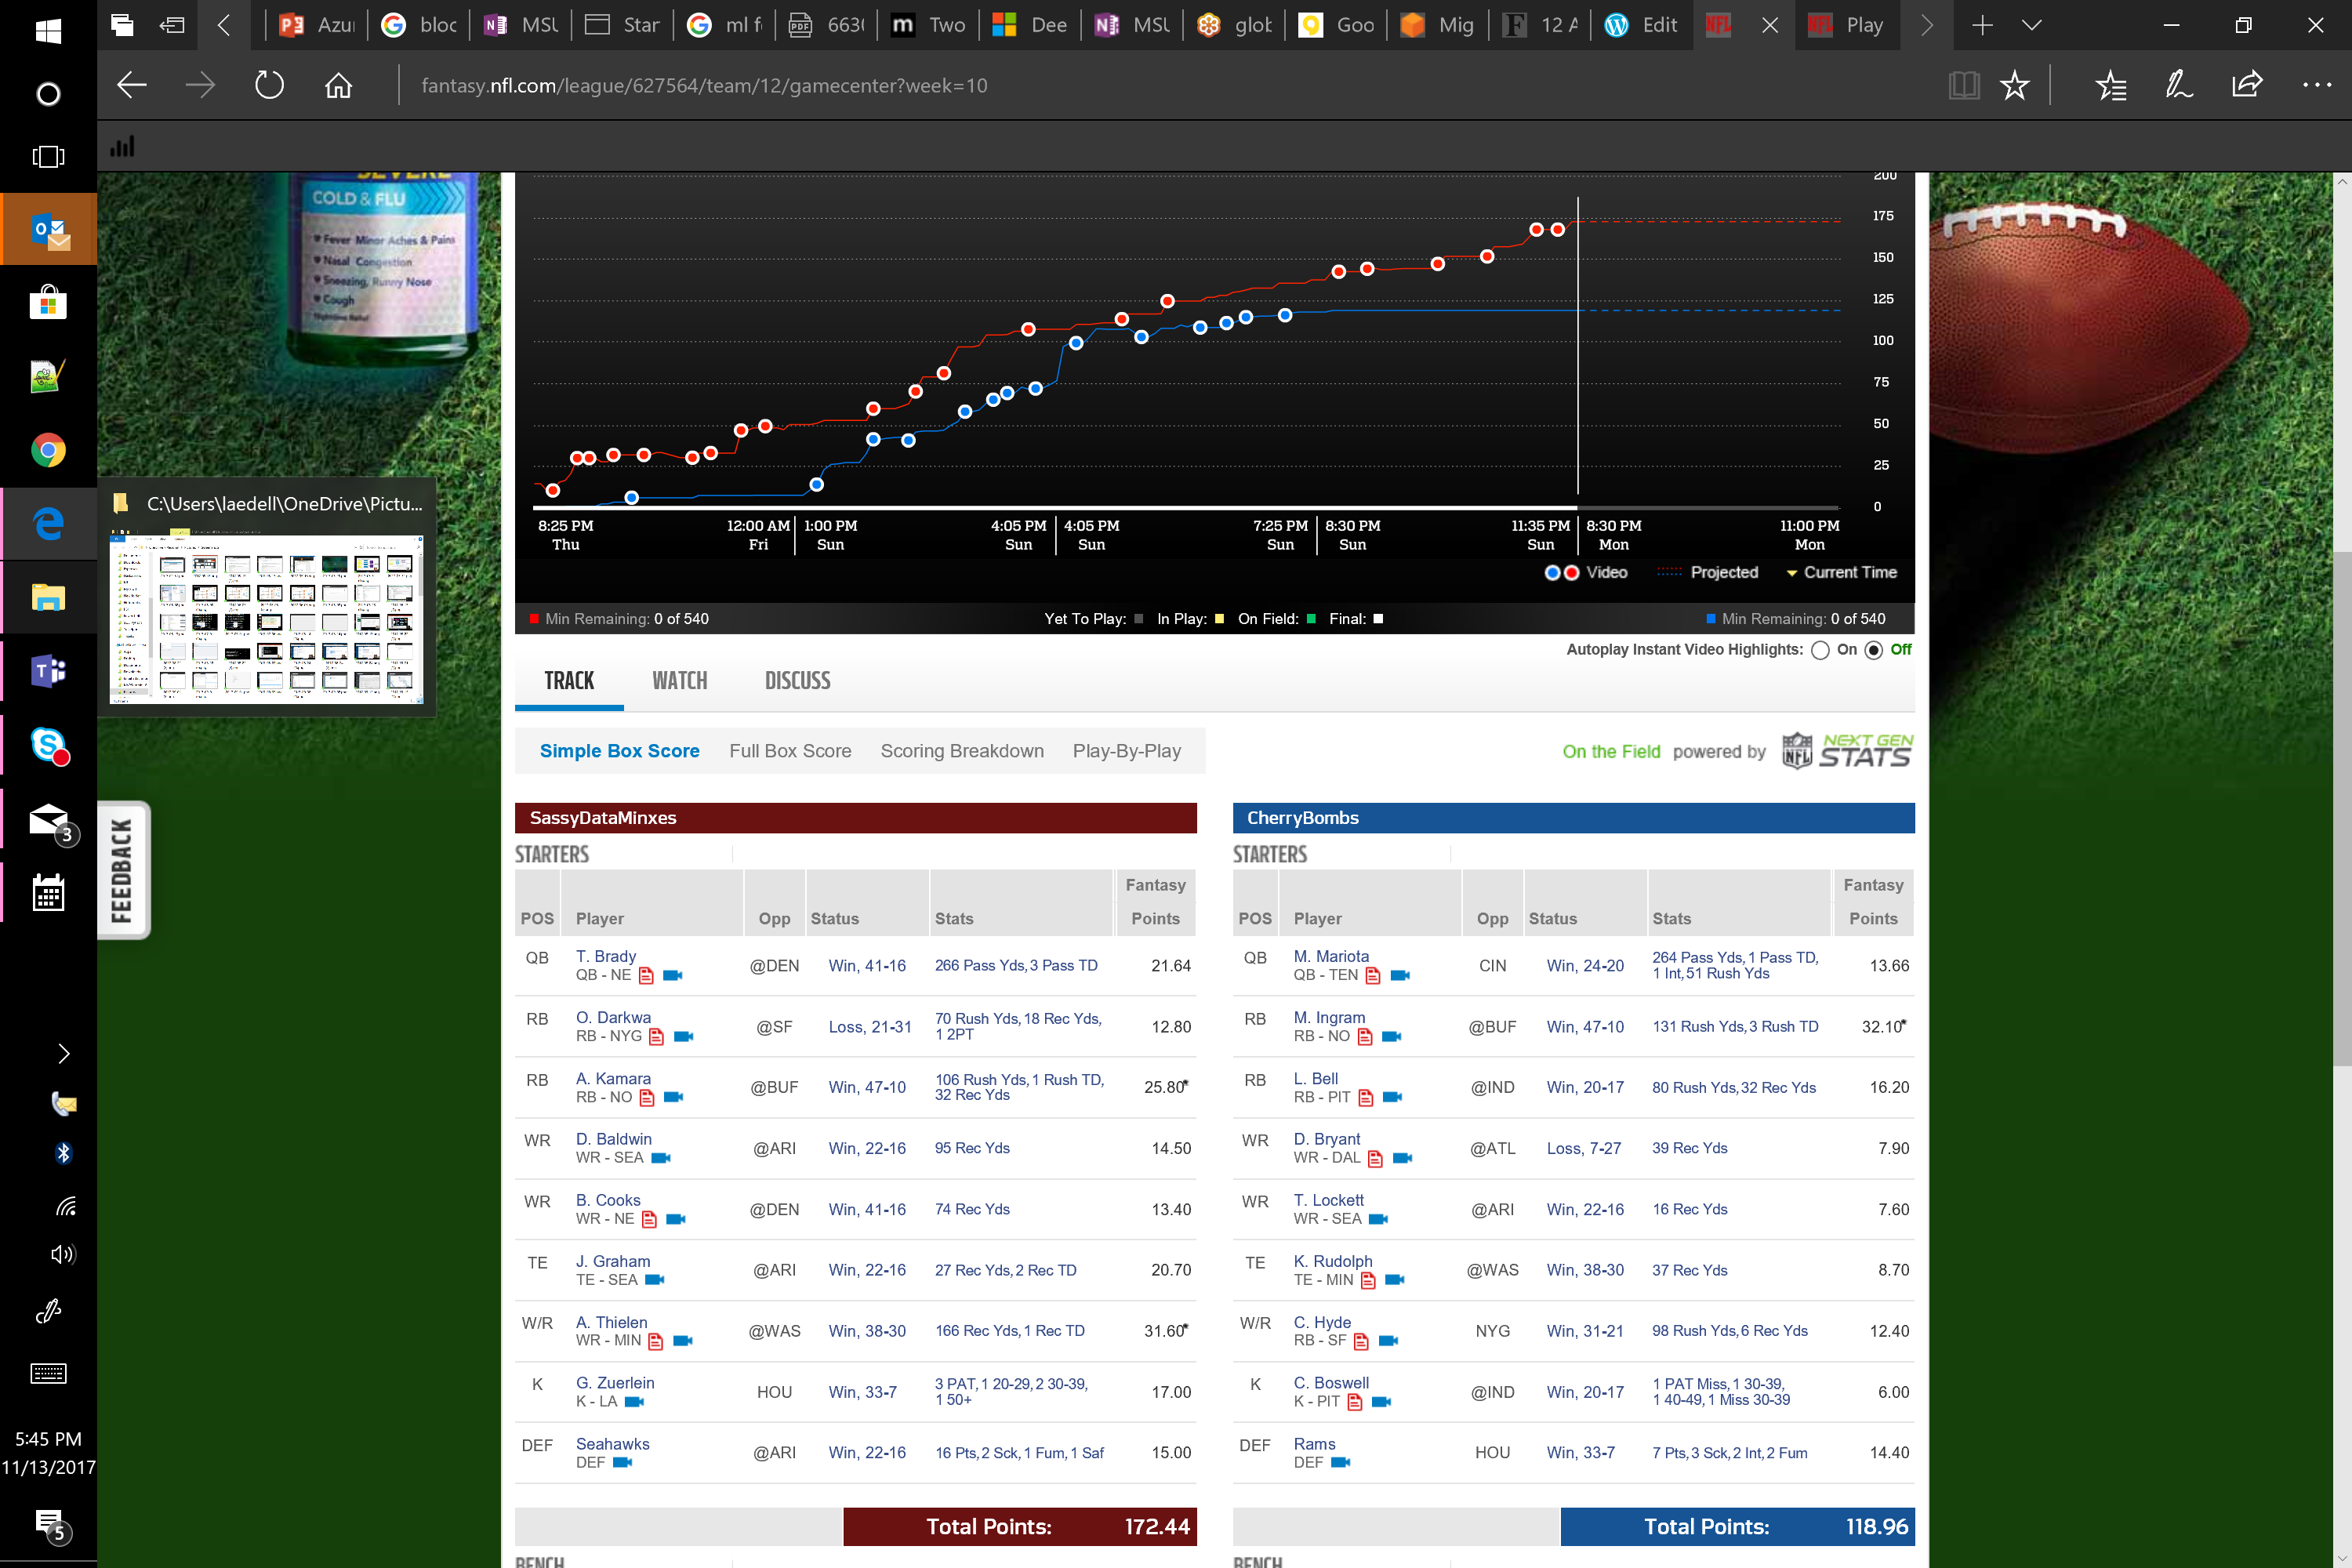
So, what I learned from my momentary lapse of positive model juju is that when I ignore the facts and outcomes of my model, no one wins. I embrace those losses because they were always part of my 2017 Fantasy Football predestination.
Week 4 – @NFLFantasy PPR Play/Bench Using #MachineLearning
Week 4 – While it is 5am on Sunday and gameplay kicks off at 9:30am today (love those London games), I am technically getting this posted before the start. Ok, well, I missed Thursday – fair enough. But we are getting there:
League 1 (PPR):
 As I mentioned in my Week 3 post, there are some things that even the best algorithmic usage cannot predict (today); injuries are one of those things that today are sort of hard to determine unless player has a propensity or an existing / underlying issue that one is tracking – Very soon, I believe that the development of the RFID program that each player’s’ uniforms now carry will yield better and better data points that can, in fact, become the Minority Report of the NFL season and predict the next great injury, based on biometric + performance + known medical history with a fair degree of certainty. But we are not there yet (at least, what is being provided to those of us NOT connected to the team’s/NFL <– a girl can dream about this kind of data coming from this type of connection, can’t she?)
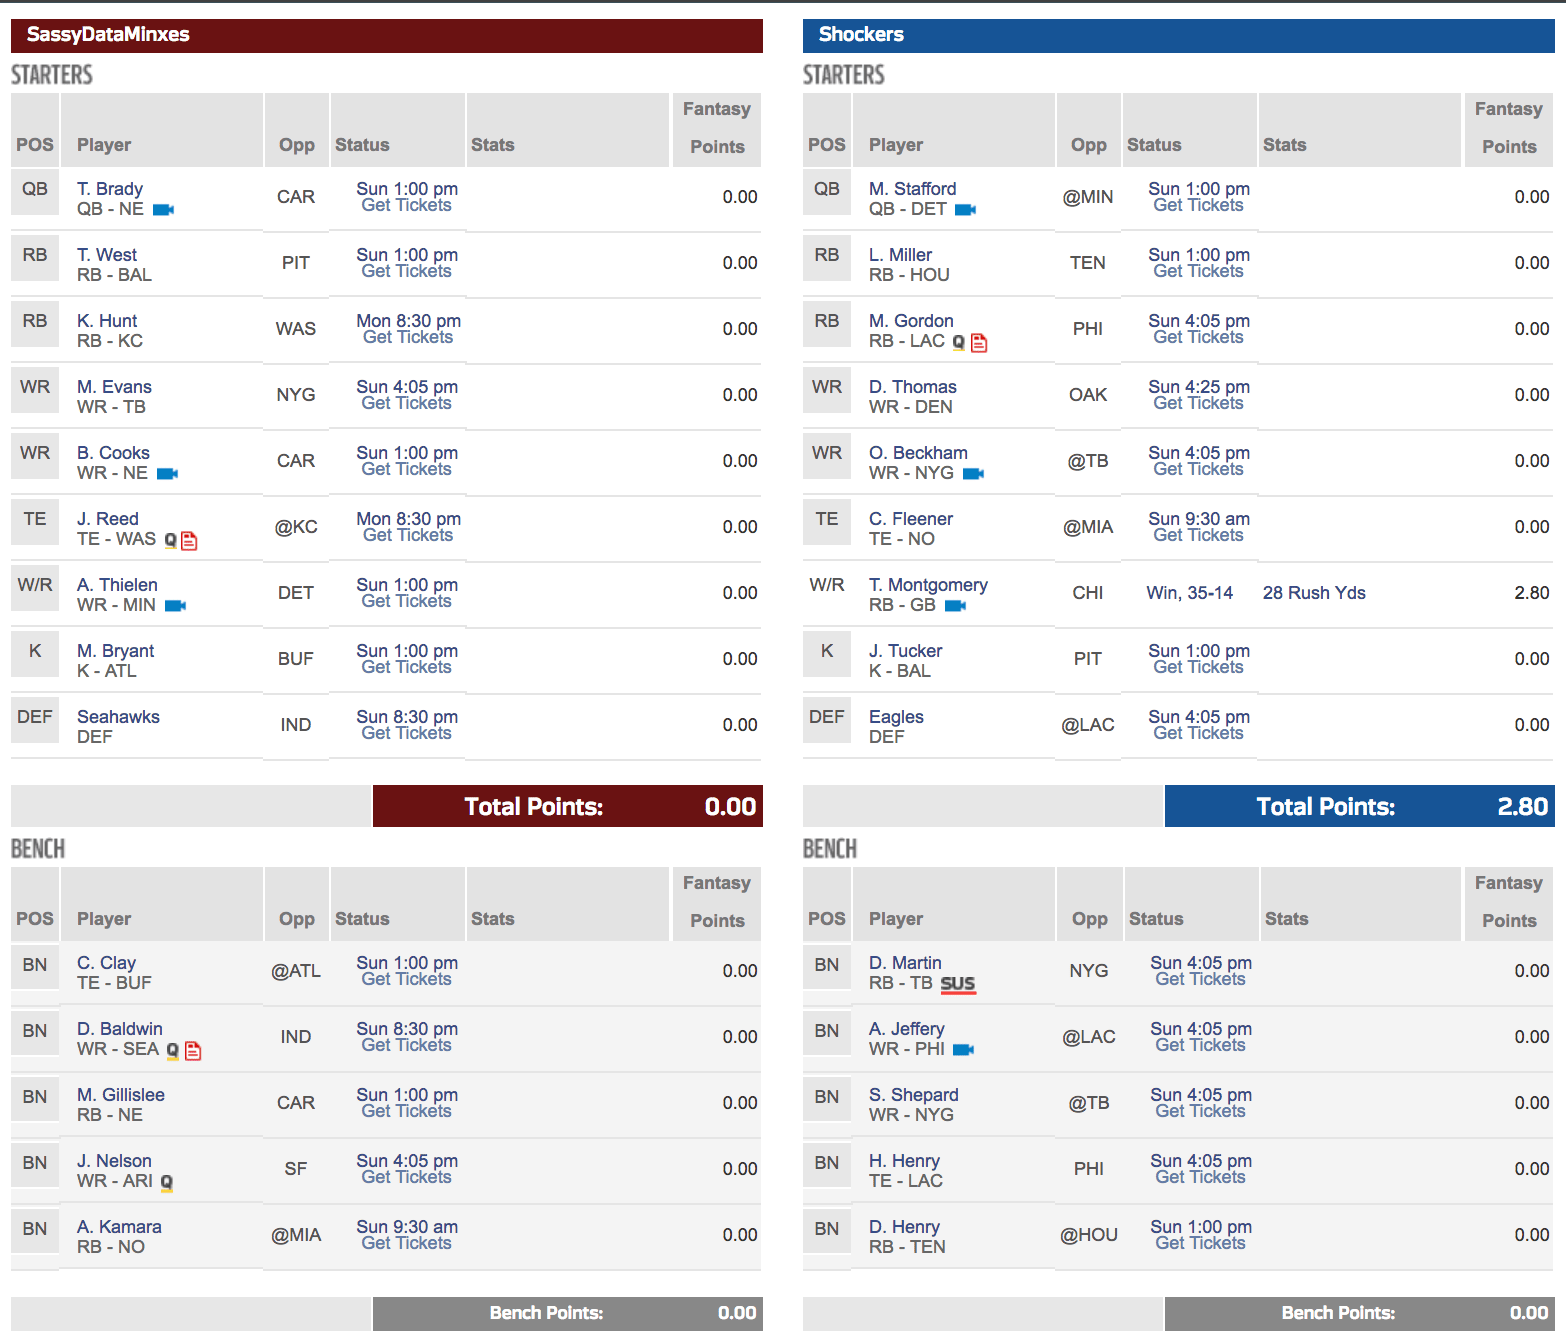
You’ll notice I have Jordan Reed in my line up – this is a hard one. He is expected to play but at what level? I picked up Charles Clay as my backup but unfortunately , Reed doesn’t play until Monday; Clay plays at 1pm today. So, I will refresh my model and then see if Reed drops any in the ranking. If nothing else, it will give me a better picture on points earned potential IF he were to play with his existing injury (albeit healed or otherwise).
I swapped out Doug Baldwin who is also questionable this week in terms of his health; and slotted Adam Thielen in. I also picked up Alvin Kamara off of the waiver wire. I have a feeling about him; as does my model. This week, he ranks right next to Terrance West given the matchup and alternates on my bench (oh woe is my RB situation) – Thank goodness for a stout WR lineup, even with injuries et al.
All in all, I am most worried about this matchup. This might be a week for a loss, even if numerically, it looks like a win on NFL.com. I guess I can thank Ty M. for making it a possibility. But O’dell B Jr. might have something else to say about that. Oh that and Melvin Gordon questionable status: if only it were so…Again, I love to dream…
League 2 (Standard): What made me thankful in League 1, has plagued me in League 2 (oh, Ty!) – In this league, I have already pulled out Jordan Reed because E. Engram ranked higher in my weekly ranking anyway. I am also taking a chance on Jarvis Landry this week (it is New Orleans after all. The point differential +/- standard deviation for Standard format sent Landry into the top 10 for the week – fingers crossed xx – #trustthemodel).
Oh yea, this is also the league where I have incurred 1 loss so far – 2 wins / 1 loss. 😦 And that loss was to none other than my man; we are competing in both League 1 and League 2; he beat me by 1.9 points Week 1 – somehow I don’t remember him feeling as bad for me with my loss that week as I did for his loss against me in Week 3…
In fact, I think he did a victory dance perhaps akin to Tom Cruise in ‘Risky Business’ – but maybe that is too much information for a Sports ML blog posting :0):
Week4-Standard-@NFLFantasy-@NFL-@Laura_E_Edell
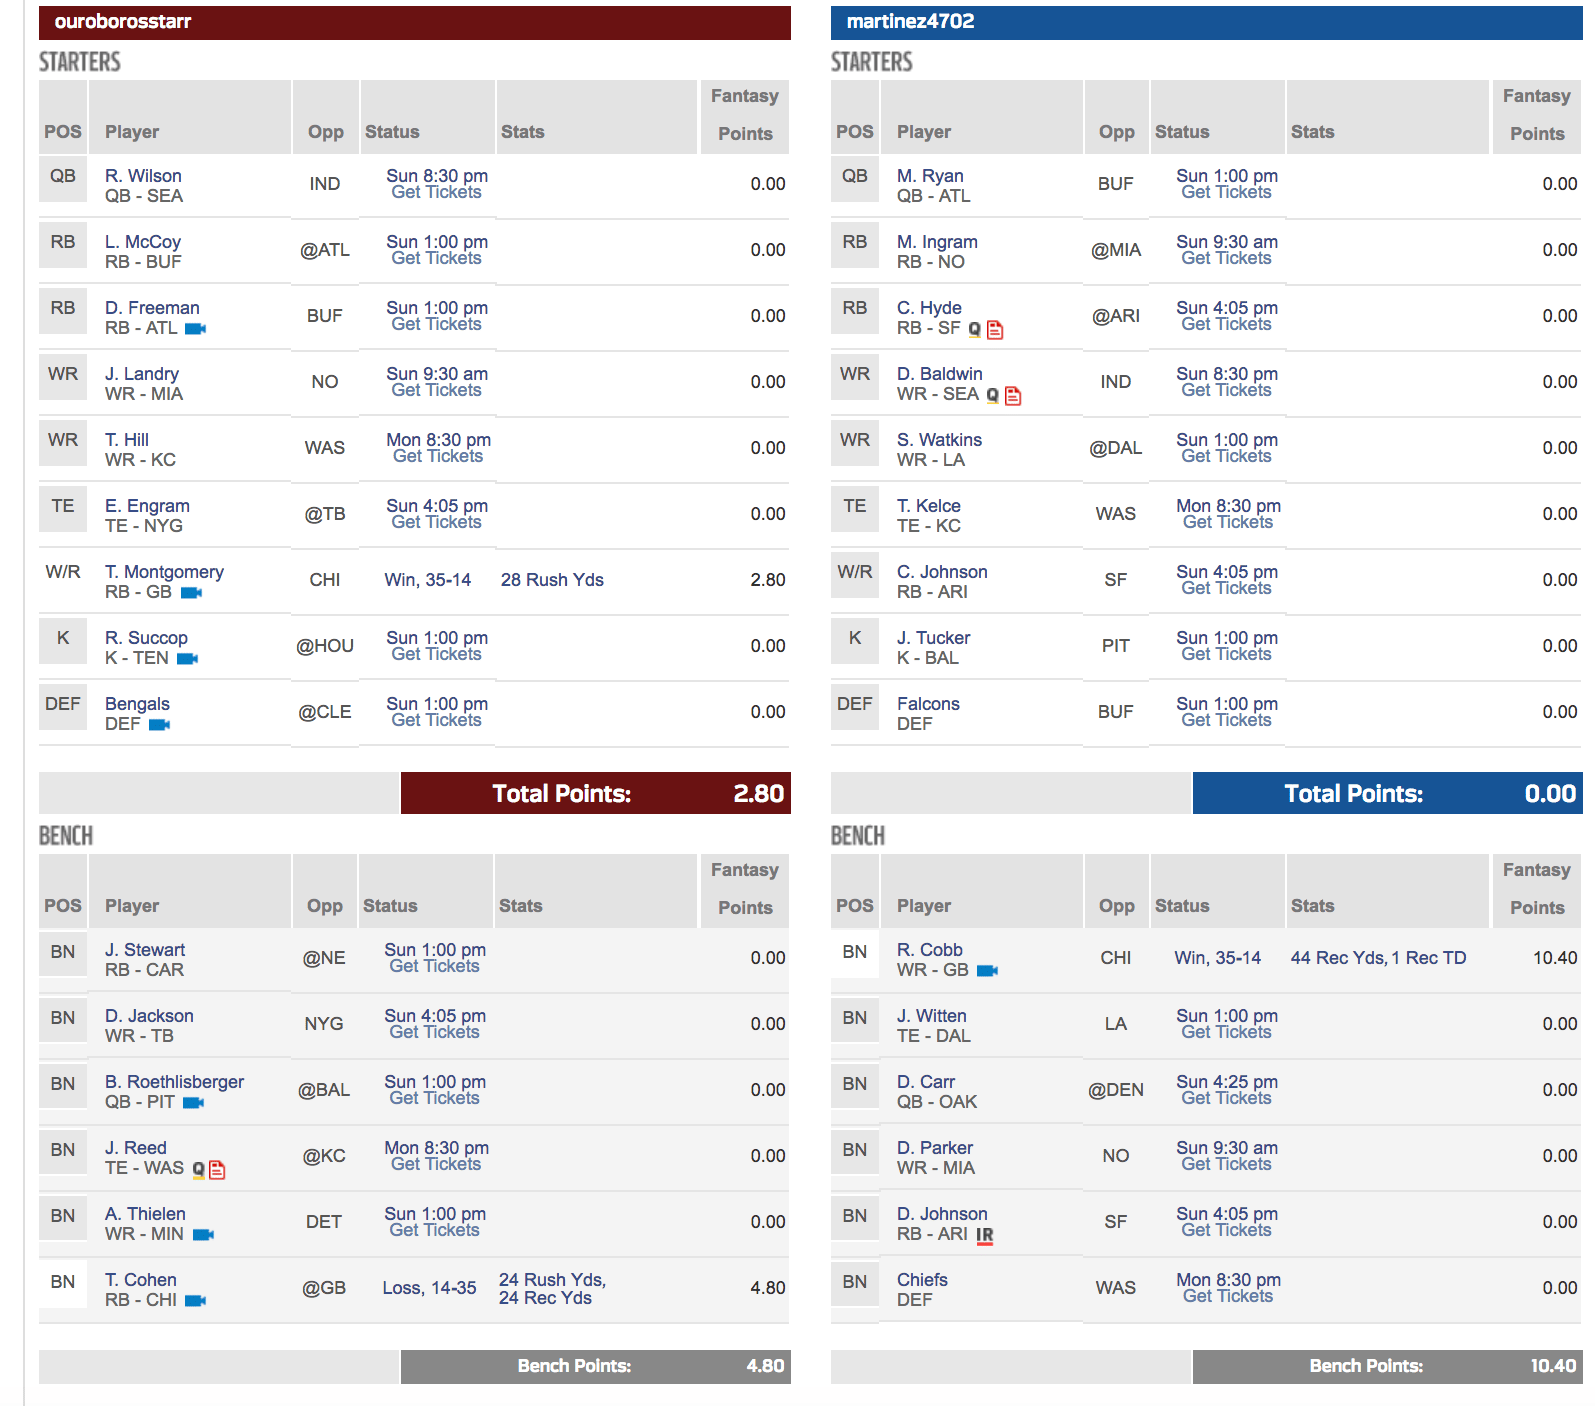
League 3 (Standard): After Thursday night, I am doing ok – I predicted 12.5 +/- .75 st dev for Jordan Howard and he earned 12.30. So, pretty spot on. Aaron Rodgers came in at 23.06, which I predicted 23.60 (what, is that my dyslexia at play; no, there was also a + / – 1.5 st dev at work, so again, spot on in terms of accuracy. So, maybe, my 3 wins and 0 losses will become 4 wins after this week. But I am not counting any chickens ever before they are hatched. Just look at what happened to my opponent / my man in Week 3 (154 points for me; 45 points for him in PPR format- that is what we call, just brutal people).

Week4-Standard-League3-@NFL-@NFLFantasy-@Laura_E_Edell
Week 3 – @NFLFantasy PPR Play/Bench Using #MachineLearning
Recap from Week 3 (sorry – I really am trying to post before Thursday night but it seems that between work right now and updating my model stats mid-week, I just run out of time).
Week 3 was wildly successful. NFL.com was closer this time in terms of predicting my win over my opponent but nowhere near to the results that I achieved. I will always stand by Russell Wilson – what kind of Seahawk would I be if I threw in the towel and in my 2nd league (Standard format), he did not fail! He was simply divine. But alas, he is not my primary league QB (Tom Brady is – a hard pill to swallow personally being a die hard Seahawks fan after what happened in a certain very important yesteryear game – but he has proven his PPR fantasy value in Week 3). Primary League Week 3 – Wins = 3 / Losses = 0 (remember, after draft day, I was projected to end the season with an 8-8 W/L ratio. So, this might be the week; maybe not).
But last week, I genuinely felt bad – Locheness Jabberwokies, my week 3 opponent, happens to also be my man. And, this annihilation just felt like a win that went one step over the line of fairness. I mean a win’s a win – but this kind of decimation belongs outside of one’s relationship. Trust me. But he was a good sport. Except, he will no longer listen to my neurotic banter about losing in any given week, even if all signs point to a loss. Somehow, when I trust my model, it all works out. Now, I can’t predict injuries mid game like what happened in Week 4 to Ty Montgomery (my League 3 Flex position player). Standard league wise, he brought home 2.3 points ~ projected to earn about 10.70 Standard points with a st. deviation of +/- 1.5. But this was my lineup for Week 3 across my 3 leagues:
League #1 (Primary PPR) – remember, I aim to not just win but also optimize my lineup. 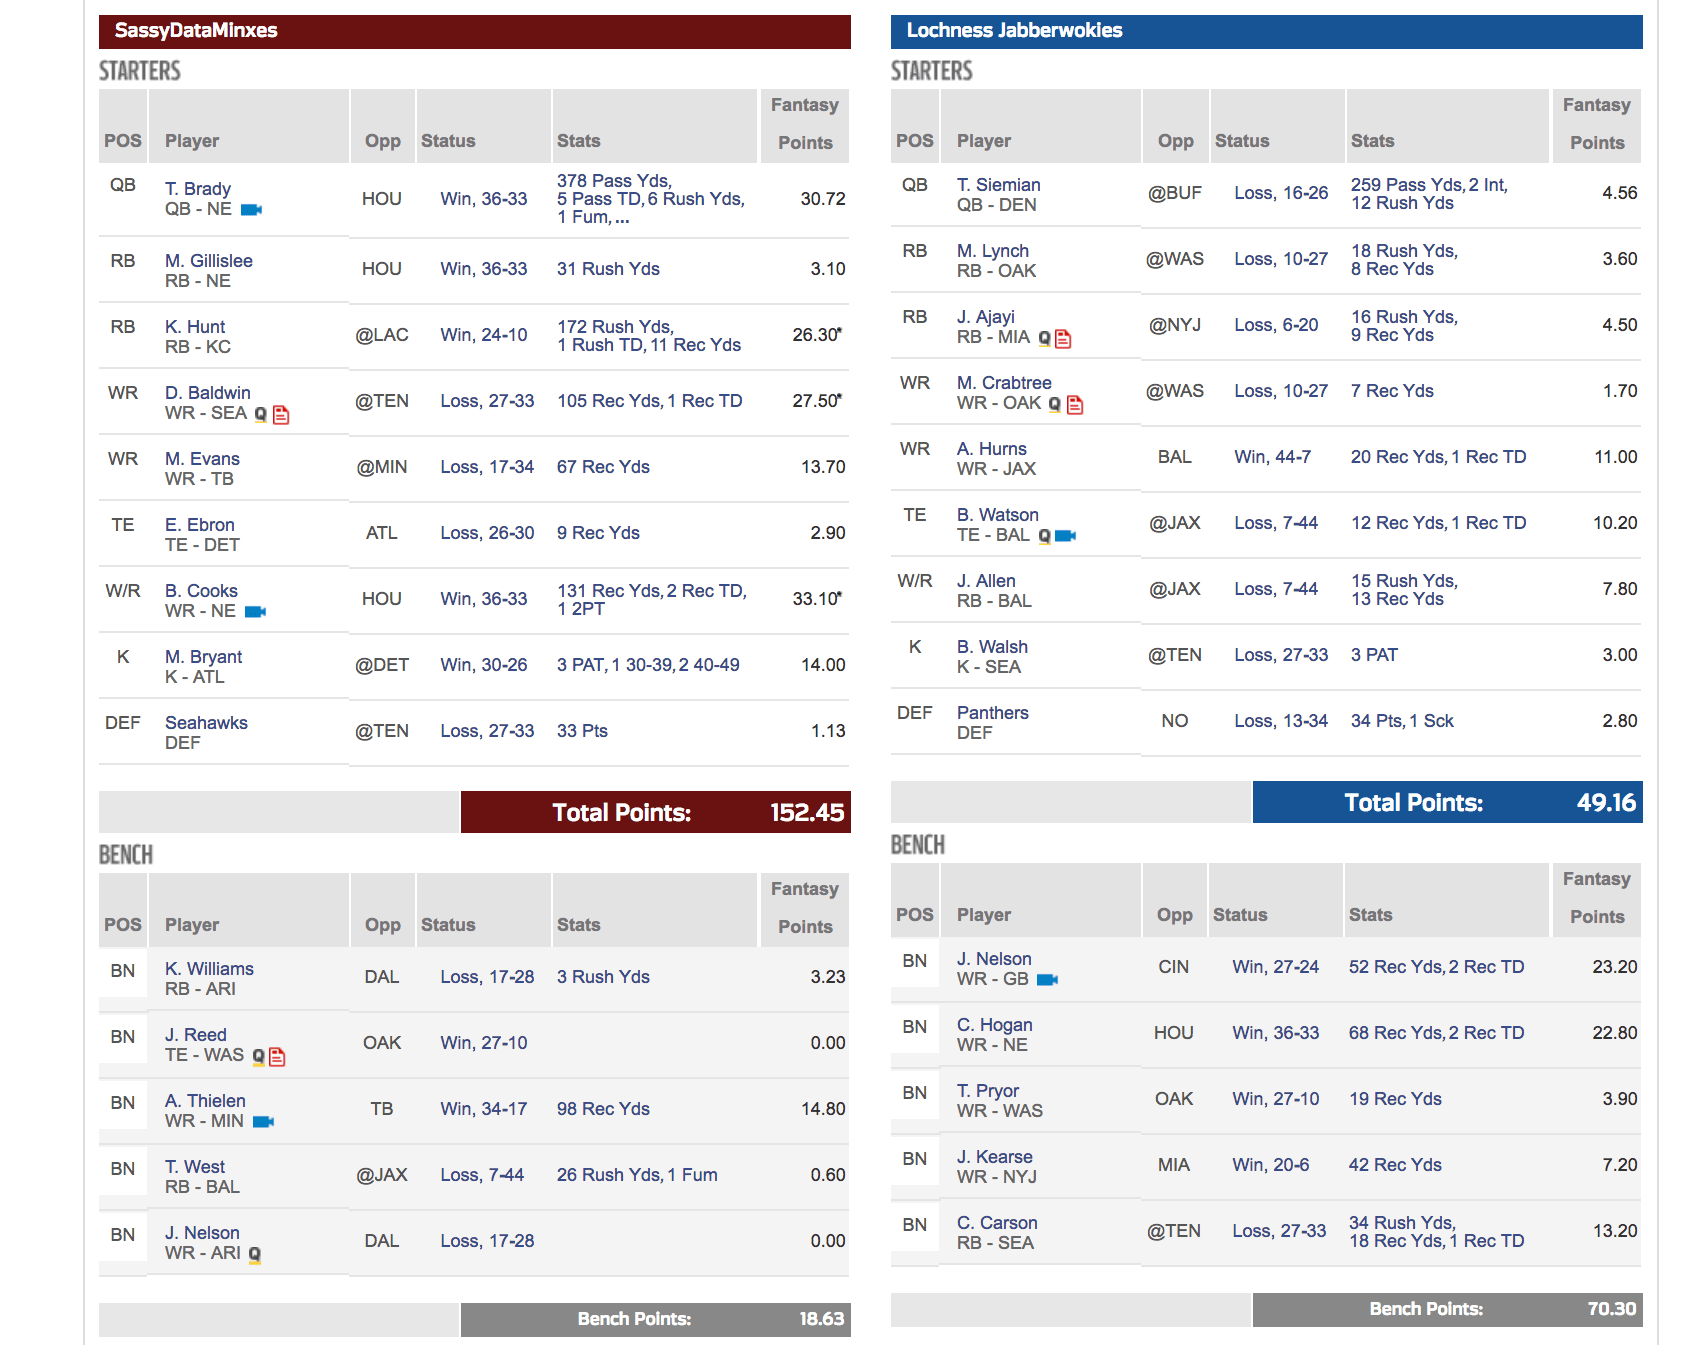
A bench full of points is a fail to me. But in this case, I benched Jordan Reed and picked up whomever was the next available TE off the waiver wire (granted he definitely contributed nothing). But out of my WR1 and WR2 + WR Flex, those I played were the best options (even though Mike Evans came in about 1.10 points less than Adam Thielen (bench), it was within the expected standard deviation, so either one would have been fine if played).
My RB situation has always been the bane of my league this year starting with my draft choices – Nothing to write home about except seeing the early value of Kareem Hunt (TG), even when NFL.com continued to project very little in his court.
Terrance West was supposed to be double digits but my model said to bench him vs. either Mike Gillislee or Kerwynn Williams. Both scored very little and essentially were within their own standard deviation negating their slight point difference.
All in all, players played worked out well and yes, though many stellar performances carried those that failed might be outliers in some regard (or at least they won’t bring home that many points week over week). But the PPR space is my golden circle of happiness – after all, I built my original algorithm using PPR league play / bench + historical point spreads + my secret sauce nearly 5 years ago; and those years of learning have “taught” the model (and me) many nuances otherwise missed by others in the sports ML space (though I respect greatly what my fellow ML “sportstaticians” put forth, my approach is very different from what I glean from others’ work).
One day, I would love to have a league with only ML Sports folks; the great battle of the algorithmic approaches – if you are interested, let me know in the comments.
League 2 (Standard): Wins = 3/Losses = 0:
As you can see, I should have played DeSean Jackson over Adam Thielen or my Flex position Ty Montgomery. And geez, I totally spaced on pulling Jordan Reed like I did in League 1. This win was largely because of Russell Wilson, as mentioned before, Devonta Freeman and the Defense waiver wire pick up of the Bengals who Im glad I picked up in time for the game. oh yeah, I am not sure why Cairo Santos shows as BYE but earned me 6 points??? NFL.com has some weird stuff happening around 12:30 last Sunday ; games showed as in play (even though kick off wasn’t for another 30 minutes); and those that showed in play erroneously allowed players to be added from the wire still as though the games weren’t kicked off. Anyway, not as proud but still another win – Year 1 for Standard; perhaps after another 5 years training Standard like my PPR league, I will have more predictable outcomes , other than luck.

#NFL.com, #Week3, #Standard,@NFLFantasy
Week 1.P2 @NFLFantasy PPR Play/Bench Using #MachineLearning
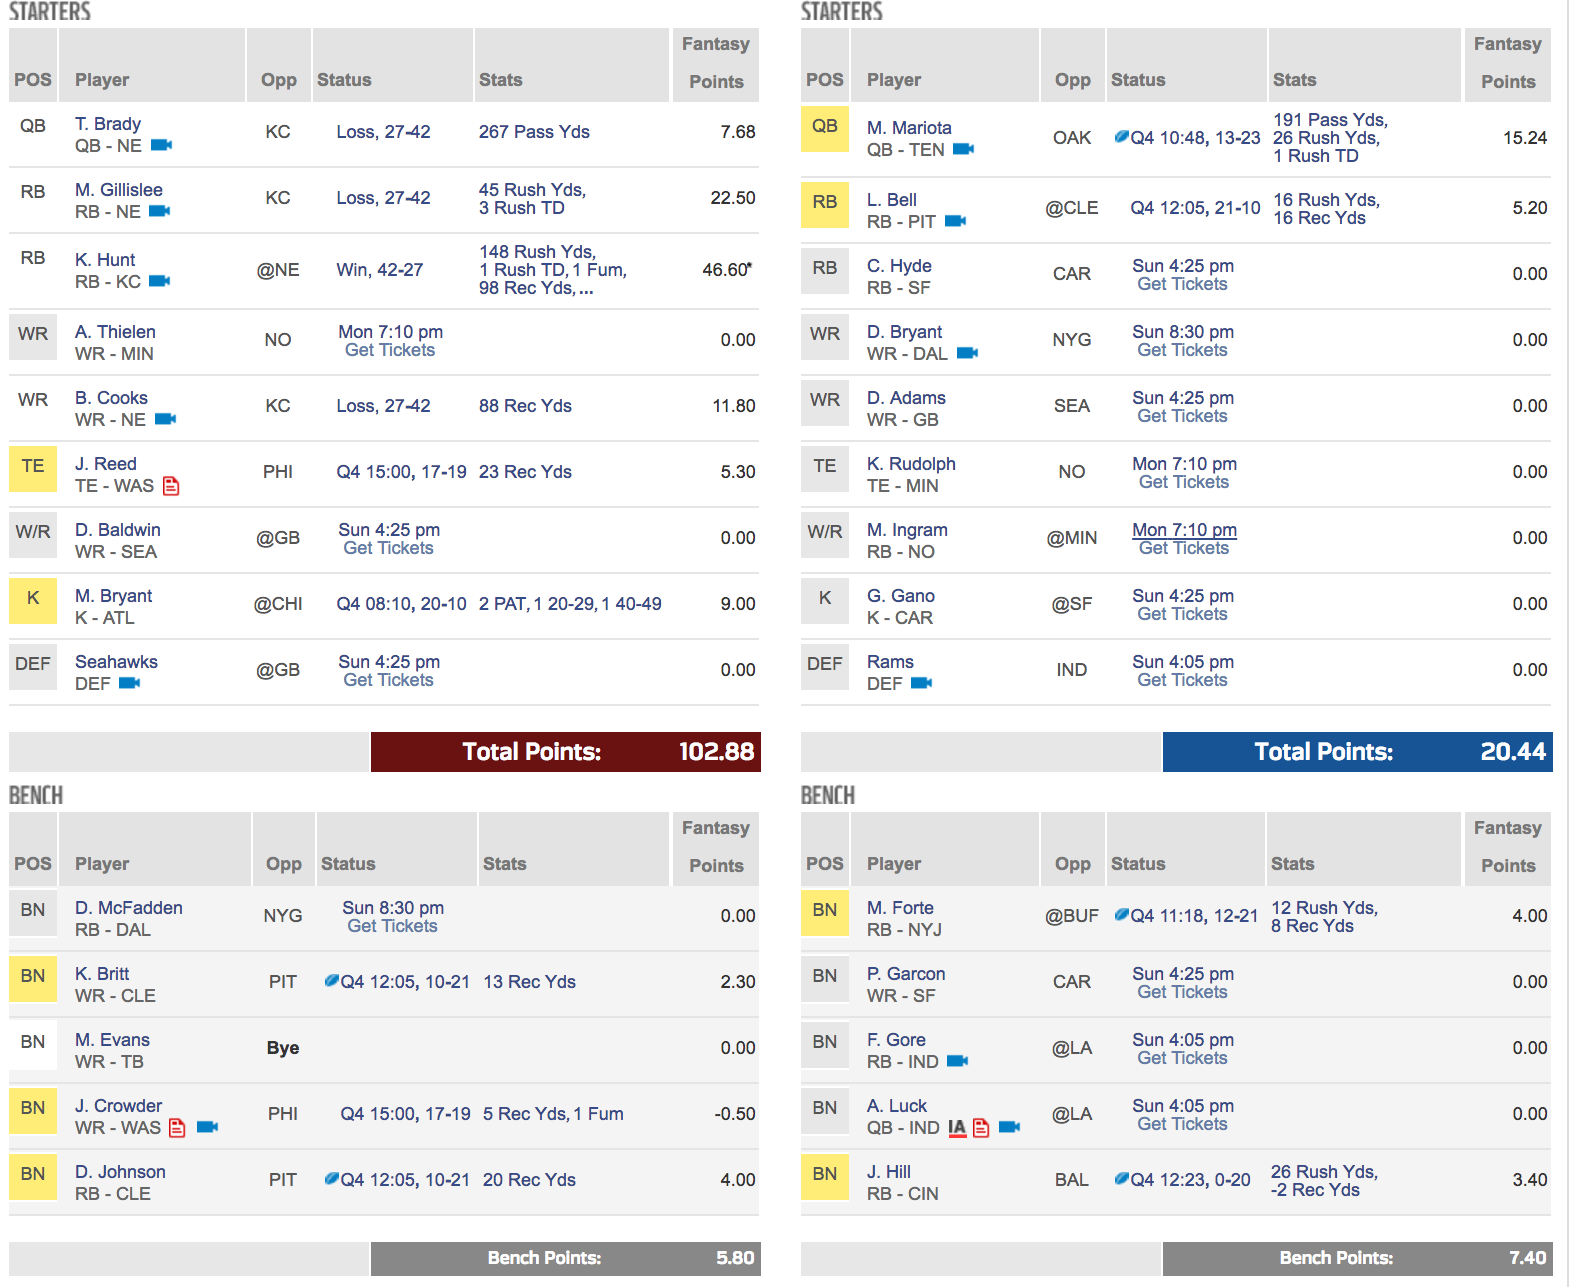
OK, so going into Monday night, I am doing pretty well. Remember, going into Sunday, I was predicted to lose by 25+ points according to @NFLFantasy (NFL.com). But of course, they course correct all throughout gameday on Sunday and now I am projected to win (not sure if anyone would need ML to determine that based on current outcome).
Here is the current status:
Me: 131.71 / Opp: 92.44
My bench only totaled 8.90 / Opp bench: 30.30
I never count my chickens before they are hatched though; I have A. Thielen left; she has M. Ingram and K. Rudolph; If my player scores 0 (which I am not projecting he will), she would need ~40 points to beat me. And crazier outliers have occurred. I knew K. Hunt would be stellar but not THAT stellar.
But I think I am most proud of my bench. Yes Evans was a forced bench due to unforeseen Bye Week and McFadden was only to fill some Elliott holes when it was expected he would not suit up. But two years ago, I was known for having more points on my bench than in my Starting Lineup. 🙂 If Year 4 of my ML approach turns out as successful as Year 2 and 3, then I might share how I do it algorithmically. Trust me, it takes a lot of patience and training time to get this right.
Week 1.P1 @NFLFantasy PPR Play/Bench Using #MachineLearning
Tardy for this party…So sorry 🙂
We are 2 hours post Sunday kick off; Thursday night came and went without my pre-blogging. This is new for me; I’ll get better. With that, here is who I played on Thursday along with my full team. This will give you a sense of play/bench choices I had.
As I mentioned, I bombed my draft. Out of the 3 leagues I drafted (1 PPR and 2 Standard), the league against my family / the one that started it all, received a grade C with a 61% likelihood of making it to the playoffs, ending the season ranked 5th (out of 10). To give perspective, last year, I was graded a B- going into Week 1, but had a likelihood of 81% of making the playoffs, ranked #2 in terms of wins and losses (11 wins, 3 losses –> and this was exactly how I ended the 2016 season) . My other two leagues graded better; both ranked as draft grade B with league 2 showing a 77% likelihood of making the playoffs, ranked #1 spot BUT with 7 wins and 7 losses (ouch). League 3 shows a playoff likelihood of 67%, ranking 3rd (8 wins, 6 losses).
All in all, I troll the waiver wire heavily and think my model has an uncanny accuracy at finding this year’s rookie-of-the-year as I mentioned in my prior post.
Going into Thursday, League 1 lineup and points scored as of 3:27pm on Sunday against my competitor. Keep in mind, as of Thursday morning, Week 1 was projected by NFL.com to go to the other person (not me), and she had gained 10 projected points between Monday and Thursday. But NFL.com projections are often incorrect. Also, my Dolphins and TB players were unexpectedly benched due to the Hurricane so that was another event previously unmodeled. Also, with Ezequiel Elliott playing in Week 1, my temporary backup (McFadden) was another forced bench. But here is who I went with:
So far, in the RB position, we nailed it (we being me and my model). Both games were played on Thursday but both players exceeded publicly available projections by a landslide. Plus of course my competitor had L. Bell, who (as of Q4) performed way under public projections. But my model flagged him as underperforming bumping up my likelihood to win this week. I also did a good job working with my subpar drafted team in terms of bench: most significantly, J. Crowder. When I updated the model, his name was flagged for underperformance and moved to bench. I had Duke Johnson in but swapped for Gillislee despite all the mixed feedback and noise online about him.
J. Reed (TE) came in 2 points under what I expected but there is still time on the clock. And my competitor has a lot of stout players on her roster to player. Hopefully D. Baldwin and A. Thielen bring home something good – My poor Seahawks defense was an emotional draft (sort of a hometown for me). Just like T Brady was the worst QB for me because I have a visceral response to his game play style evident by the points above. Hopefully he will perform at par with what everyone expects from him.
Win @NFLFantasy PPR Leagues w/ ML
So, the past 3 years I have been using #machine-learning (ML) to help me in my family based PPR #fantasy-football league. When I joined the league, the commissioner and my partner’s father, said I would never win using statistics as the basis of my game play. Being cut from the “I’ll show you” aka “well, fine…I’ll prove it to you” cloth that some of us gals working in the tech industry dawn as we break down stereotypical walls and glass ceilings, is something I’ve always enjoyed about my career and love that there is an infographic to tell the tale courtesy of mscareergirl.com (only complaint is the source text in white is basically impossible to read but at least the iconography and salaries are legible):

infographic provided by Danyel Surrency Jones on mscareergirl.com
I’ve never whined that in my industry, I tend to work primarily with the male species or that they are “apparently” paid more *on average* because some survey says so. My work ethic doesn’t ride on gender lines — This train departs from the “proven value based on achievements earned & result in commensurate remuneration” station (woah, that’s a mouthful). I take challenges head-on not to prove to others, but to prove to myself, that I can do something I set my sights on, and do that something as well, if not better, than counterparts. Period. Regardless of gender. And that track has led to the figurative money ‘line’ (or perhaps it’s literal in the case of DFS or trains – who’s to say? But I digress…more on that later).

So, I joined his league on NFL.com, so aptly nicknamed SassyDataMinxes (not sure who the other minxes are in my 1 woman “crew” but I never said I was grammarian; mathematician, aka number ninja, well, yes; but lingualist, maybe not.
Year 1, as to be expected *or with hindsight*, was an abysmal failure. Keep in mind that I knew almost absolute nothing when it came to Pro Football or Fantasy sports. I certainly did not know players or strategies or that fantasy football extended beyond Yahoo Pick ‘Em leagues, which again, in hindsight, would have been a great place to start my learning before jumping head 1st into the world of PPR/DFS.
At its core, it requires you pick the weekly winning team from 2 different competitors and assuming you have the most correct picks, you win that week. If there are no teams on BYE that week, you have 32 teams or 16 games to “predict outcomes” ; a binary 0 or 1 for lose or win in essence. Right? Never, she exclaims, because WAIT, THERE’S MORE: you have to pick a winner based on another factor: point spread. Therefore, if 0 means lost and 1 means won, you get a 1 per win EXCEPT if the spread of points is less than what the “book makers” out of Vegas determine to be the “winning spread” – You could technically pick the winning team and still get a goose egg for that matchup if the team did not meet their point spread (ooh, it burns when that happens). The team that wins happily prancing around the field singing “We are the Champions” while you are the loser for not betting against them because they were comfortable winning by a paltry lesser amount than necessary – Ooh, the blood boils relieving those early games – especially since my Grandmother who won that year picked her teams based on cities she liked or jersey colors that her ‘Color Me Happy’ wheel said were HER best COOL tones; the most unscientific approach worked for her so many times I now think she actually IS A bookie running an illegal operation out of her basement, which fronts as ‘her knitting circle” – Yah, as if any of us believe that one, Grandma :)! (She is a walking football prediction algorithm).
So, something as seemingly simple as Yahoo Pick ‘Em can actually be harder than it appears unless you are her. But, still…markedly easier than a PPR league; and light years easier than DFS/Auction style fantasy leagues when it comes to predicting gaming outcomes at the player, weekly matchup and league perspectives.
Hindsight is such a beautiful thing (*I think I have said that before*) because to espouse all of these nuggets of knowledge as though I am the Alliteration Arbiter of All –> The Socratic Seer of Scoring Strategies…And again, as always I digress (but, ain’t it fun!).
OK, let’s continue…So, we’ve established that fantasy football gaming outcomes requires a lot of *something* — And we’ve established that just cuz it seems simple, or did, when trying to predict outcomes along a massively mutable set of variables *wait, why didn’t I just READ that sentence or THINK it when I started! If I could go back in time and ask my 3 year younger:
“Self, should I stop this nonsense now, alter the destination or persevere through what, at times, might seems like a terrible journey? *HUM, I think most pensively*.
And then answer myself, just like the good only-child I am:
“NEVER – Self, nothing worth getting is easy to get, but the hardest fought wins are the most worthwhile when all is said and done and remember, don’t let the bedbugs bite; YOU’RE bigger than them/that.”
Or something along those lines, perhaps…
NEVER was my answer because in 2015 and 2016 (Years 2 and 3), I was #1 in the league and won those coveted NFL.com trophies and a small pool of money. But what I won most of all was bragging rites.
Oh baby, you can’t buy those…
Not even on the Dark Web from some Onion-Routed Darker Market. Especially the right to remind a certain commissioner / neighsayer du jour / father-in-law-like that my hypothesis of using ML & statistics ALONE could beat his years of institutional football knowledge and know-how. I also won a 2nd NFL-managed league that I joined in Year 3 to evaluate my own results with a different player composition.
So Year 1 was a learning year, a failure to others in the league but super valuable to me. Year 2 was my 1st real attempt to use the model, though with much supervision and human “tweaking” ; Year 3, non-family league (league #2 for brevity sake; snarky voice in head “missed that 4 paragraphs ago” – Burn!), I had drafted an ideal team, rated A- .
Year 3 being a double test to ensure Year 1 wasn’t a double fluke. Two leagues played:
League #1 with the family, was a team comprised of many non-ideal draft picks chosen during non-optimized rounds (QB in round 2, DEF in round 4 etc). But the key in both Year 2 and 3, was spotting the diamonds in the rookie rough – my model bubbled up unknown players or as they are known to enthusiasts: “deep sleepers” that went on to become rookie-of-the-year type players: in 2015, that was Devonta Freeman (ATL); in 2016, that was ‘Ty-superfreak’ Hill aka Tyreek Hill (Chiefs) and even better, Travis Kelce (who had been on my roster since 2015 but rose to the occasion in 2016, BEEEG-TIME) . That has always been a strength of my approach to solving this outcomes conundrum.
So, that all being said, in this Year 4, I plan to blog PRE-GAME with my predictions for my team with commentary on some of the rankings of other players. Remember, it isnt just a player outcome, but it is player outcome in relation to your matchup that week within your league and in the context of who best to play vs. bench given those weekly changing facets. Some weeks, you might look like a boss according to NFL.com predictions; but in fact, should be playing someone else who might have a lower-than-you-are-comfortable-putting-into-your-lineup prediction. Those predictions folks HAVE ISSUES – But I believe in the power of model evaluation and learning, hence the name Machine Learning or better yet, Deep Learning approaches.
Side note: reminds me of that “SAP powered” player comparison tool:
 which was DOWN / not accessible most of the aforementioned season when it was being hammered on by fans in need of a fantasy fix (reminds me of an IBM Watson joke but I was keep that one to myself ) – whomever is at fault – you should make sure your cloud provider “models” out an appropriate growth-based capacity & utilization plan IF you are going to feature it on your fantasy football site, NFL.com.
Next posting will be all about how I failed during Year 4’s draft (2017) and what I am planning to do to make up for it using the nuggets of knowledge that is an offshoot of retraining the MODEL(s) during the week – Plus, I will blog my play/bench predictions which will hopefully secure a week 1 win (hopefully because I still need to retrain this week but not until Wednesday :)).
In a separate post, we’ll talk through the train…train…train phases, which datasets are most important to differentiate statistically important features from the sea of unworthy options sitting out waiting for you to pluck them into your world. But dont fall prey to those sinister foe…They might just be the “predictable” pattern of noise that clouds one’s senses. And of course, scripting and more scripting; so many lines of code were written and rewritten covering the gamut of scripting languages from the OSS data science branch (no neg from my perspective on SaS or SPSS other than they cost $$$ and I was trained on R in college *for free* like most of my peers) – well, free is a relative term, and you take the good with the bad when you pull up your OSS work-boots –> R has its drawbacks when it comes to the viability of processing larger than life datasets without herculean sampling efforts just to be able to successfully execute a .R web scraping script without hitting the proverbial out of memory errors, or actually train the requisite models that are needed to solve said self-imposed ML fantasy football challenges such as this. Reader thinks to oneself, “she sure loves those tongue twisting alliterations.”
And gals, I love helping out a fellow chica (you too boys/men, but you already know that, eh) — Nobody puts baby in the corner, and I never turn my back on a mind in need or a good neg/dare.
Well, Year 4 — Happy Fantasy Football Everyone — May the wind take you through the playoffs and your scores take you all the way to the FF Superbowl 🙂
Eye Tracking & Applied ML: Soapbox Validations
Anyone who has read my blog (shameless self-plug: http://www.lauraedell.com) over the past 12 years will know, I am very passionate about drinking my own analytical cool-aid. Whether during my stints as a Programmer, BI Developer, BI Manager, Practice Lead / Consultant or Senior Data Scientist, I believe wholeheartedly in measuring my own success with advanced analytics. Even my fantasy football success (more on that in a later post) can be attributed to Advanced Machine Learning…But you wouldn’t believe how often this type of measurement gets ignored.
![]()
Introducing you, dear reader, to my friend “Eye-Tracker” (ET). Daunting little set of machines in that image, right?! But ET is a bonafide bada$$ in the world of measurement systems; oh yeah, and ET isn’t a new tech trend – in fact, mainstream ET systems are a staple of any PR, marketing or web designers’ tool arsenal as a stick to measure program efficacy between user intended behavior & actual outcomes/actions.
In my early 20’s, I had my own ET experience & have been a passionate advocate since, having witnessed what happens when you compound user inexperience with poorly designed search / e-commerce operator sites. I was lucky enough to work for the now uber online travel company who shall go nameless (okay, here is a hint: remember a little ditty that ended with some hillbilly singing “dot commmm” & you will know to whom I refer). This company believed so wholeheartedly in the user experience that they allowed me, young ingénue of the workplace, to spend thousands on eye tracking studies against a series of balanced scorecards that I was developing for the senior leadership team. This is important because you can ASK someone whether a designed visualization is WHAT THEY WERE THINKING or WANTING, even if built iteratively with the requestor. Why, you ponder to yourself, would this be necessary when I can just ask/survey my customers about their online experiences with my company and saved beaucorp $$.
Well, here’s why: 9x out of 10, survey participants, in not wanting to offend, will nod ‘yes’ instead of being honest, employing conflict avoidance at its best. Note, this applies to most, but I can think of a few in my new role who are probably reading this and shaking their head in disagreement at this very moment.
Eye tracking studies are used to measure efficacy by tracking what content areas engage users’ brains vs. areas that fall flat, are lackluster, overdesigned &/or contribute to eye/brain fatigue. It measures this by “tracking” where & for how long your eyes dwell on a quadrant (aka visual / website content / widget on a dashboard) and by recording the path & movement of the eyes between different quadrants’ on a page. It’s amazing to watch these advanced, algorithmic-tuned systems, pick up even the smallest flick of one’s eyes, whether darting to or away from the “above-fold” content, in ‘near’ real-time. The intended audience being measured generates the validation statistics necessary to evaluate how well your model fit the data. In the real-world, receiving attaboys or “ya done a good job” high fives should be doled out only after validating efficacy: eg. if customers dwell time increases, you can determine randomness vs. intended actual; otherwise, go back to the proverbial drawing board until earn that ‘Atta boy’ outright.
What I also learned which seems a no-brainer now; people read from Left Top to Right Bottom (LURB). So, when I see anything that doesn’t at LEAST follow those two simple principles, I just shake my head and tisk tisk tisk, wondering if human evolution is shifting with our digital transformation journey or are we destined to be bucketed with the “that’s interesting to view once” crowd instead of raising to the levels of usefulness it was designed for.
Come on now, how hard is it to remember to stick the most important info in that top left quadrant and the least important in the bottom right, especially when creating visualizations for use in the corporate workplace by senior execs. They have even less time & attention these days to focus on even the most relevant KPIs, those they need to monitor to run their business & will get asked to update the CEO on each QTR, with all those fun distractions that come with the latest vernacular du-jour taking up all their brain space: “give me MACHINE LEARNING or give me death; the upstart that replaced mobile/cloud/big data/business intelligence (you fill in the blank).
But for so long, it was me against the hard reality that no one knew what I was blabbing on about, nor would they give me carte blanche to re-run those studies ever again , And lo and behold, my Laura-ism soapbox has now been vetted, in fact, quantified by a prestigious University professor from Carnegie, all possible because a little know hero named Edmond Huey, now near and dear to my heart, grandfather of the heatmap, followed up his color-friendly block chart by building the first device capable of tracking eye movements while people were reading. This breakthrough initiated a revolution for scientists but it was intrusive and readers had to wear special lenses with a tiny opening and a pointer attached to it like the 1st image pictured above.
Fast forward 100 years…combine all ingredients into the cauldron of innovation & technological advancement, sprinkled with my favorite algorithmic pals: CNN & LSTM & voila! You have just baked yourself a popular visualization known as a heat/tree map (with identifiable info redacted) :
 This common visual is akin to eye tracking analytics which you will see exemplified in the last example below. Cool history lesson, right?
Even cooler is this example from a travel website ‘Travel Tripper’ which published Google eye-tracking results specific to the hotel industry. Instead of a treemap that you might be used to (akin to a Tableau or other BI tool visualization OOTB), you get the same coordinates laid out over search results in this example; imagine having your website underneath and instead of guessing what content should be above or below the fold, in the top left or right of the page, you can use these tried and true eye tracking methods to quantify exactly what content items customers or users are attracted to 1st and where their eyes “dwell” the longest on the page (red hot).
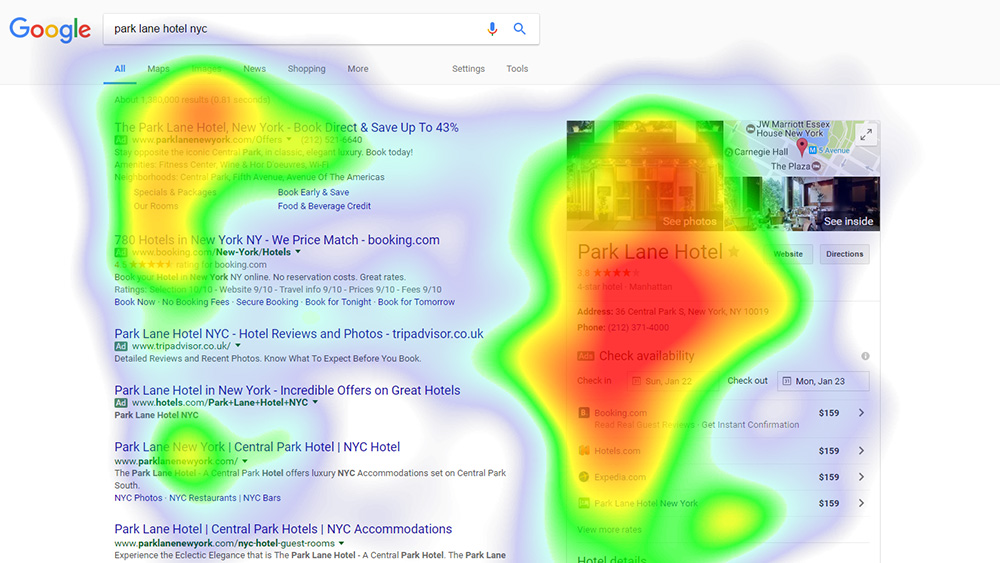
So, for those non-believers, I say, become a web analytic trendsetter, driving the future of machine design forward (ala “Web Analytics 3.0”).
Be a future-thinker, forward mover, innovator of your data science sphere of influence, always curious yet informed to make intelligent choices.
Microsoft Data AMP 2017
Data AMP 2017 just finished and some really interesting announcements came out specific to our company-wide push into infusing machine learning, cognitive and deep learning APIs into every part of our organization. Some of the announcements are ML enablers while others are direct enhancements.
Here is a summary with links to further information:
- SQL Server R Services in SQL Server 2017 is renamed to Machine Learning Services since both R and Python will be supported. More info
- Three new features for Cognitive Services are now Generally Available (GA): Face API, Content Moderator, Computer Vision API. More info
- Microsoft R Server 9.1 released: Real time scoring and performance enhancements, Microsoft ML libraries for Linux, Hadoop/Spark and Teradata. More info
- Azure Analysis Services is now Generally Available (GA). More info
- **Microsoft has incorporated the technology that sits behind the Cognitive Services inside U-SQL directly as functions. U-SQL is part of Azure Data Lake Analytics(ADLA)
- More Cortana Intelligence solution templates: Demand forecasting, Personalized offers, Quality assurance. More info
- A new database migration service will help you migrate existing on-premises SQL Server, Oracle, and MySQL databases to Azure SQL Database or SQL Server on Azure virtual machines. Sign up for limited preview
- A new Azure SQL Database offering, currently being called Azure SQL Managed Instance (final name to be determined):
- Migrate SQL Server to SQL as a Service with no changes
- Support SQL Agent, 3-part names, DBMail, CDC, Service Broker
- **Cross-database + cross-instance querying
- **Extensibility: CLR + R Services
- SQL profiler, additional DMVs support, Xevents
- Native back-up restore, log shipping, transaction replication
- More info
- Sign up for limited preview
- SQL Server vNext CTP 2.0 is now available and the product will be officially called SQL Server 2017:
Those I am most excited about I added ** next to.
This includes key innovations with our approach to AI and enhancing our deep learning compete against Google TensorFlow for example. Check out the following blog posting: https://blogs.technet.microsoft.com/dataplatforminsider/2017/04/19/delivering-ai-with-data-the-next-generation-of-microsofts-data-platform/ :
- The first is the close integration of AI functions into databases, data lakes, and the cloud to simplify the deployment of intelligent applications.
- The second is the use of AI within our services to enhance performance and data security.
- The third is flexibility—the flexibility for developers to compose multiple cloud services into various design patterns for AI, and the flexibility to leverage Windows, Linux, Python, R, Spark, Hadoop, and other open source tools in building such systems.
Wonderful World of Sports: Hey NFL, Got RFID?
As requested by some of my LinkedIn followers, here is the NFL Infographic about RFID tags I shared a while back:
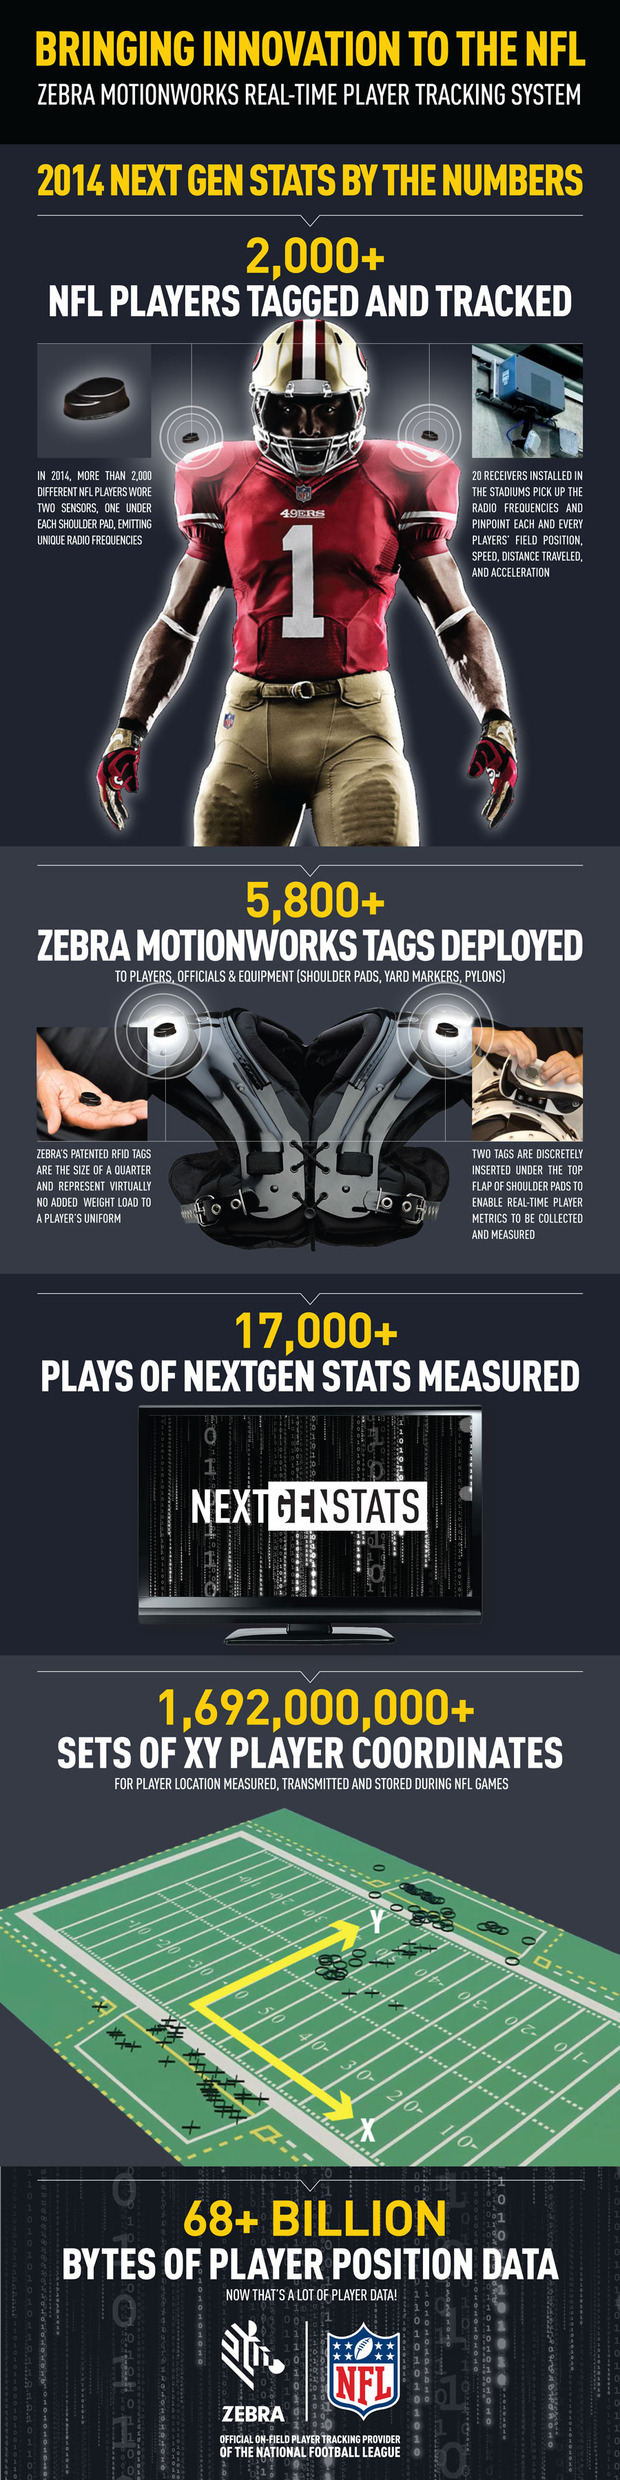
I hope @NFL @XboxOne #rfid data becomes more easily accessible. I have been tweeting about the Zebra deal for 6 months now, and the awesome implications this would have on everything from sports betting to fantasy enthusiasts to coaching, drafting and what have you. Similarly, I have built a fantasy football (PPR) league bench/play #MachineLearning model using #PySpark which, as it turns out, is pretty good. But it could be great with the RFID stream.

This is where the #IoT rubber really hits the road because there are so many more fans of the NFL than there are folks who really grok the “Connected Home” (not knocking it, but it doesn’t have the reach tentacles of the NFL). Imagine measuring the burn-rate output vs. performance degradation of these athletes mid game and one day, being able to stream that on the field or booth for game course corrections. Aah, a girl can only dream…
Is Machine Learning the New EPM Black?
I am currently a data scientist & am also a certified lean six sigma black belt. I specialize in the Big Data Finance, EPM, BI & process improvement fields where this convergence of skills has provided me the ability to understand the interactions between people, process and technology/ tools.
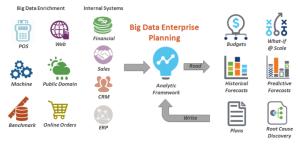
I would like to address the need to transform traditional EPM processes by leveraging more machine learning to help reduce forecast error and eliminate unnecessary budgeting and planning rework and cycle time using a 3 step ML approach:
1st, determine which business drivers are statistically meaningful to the forecast (correlation) , eliminating those that are not.
2nd, cluster those correlated drivers by significance to determine those that cause the most variability to the forecast (causation).
3rd, use the output of 1 and 2 as inputs to the forecast, and apply ML in order to generate a statistically accurate forward looking forecast.
Objection handling, in my experience, focuses on the cost, time and the sensitive change management aspect- how I have handled these, for example, is as such :
- Cost: all of these models can be built using free tools like R and Python data science libraries, so there is minimal to no technology/tool capEx/opEx investment.
- Time: most college grads with either a business, science or computer engineering degree will have undoubtedly worked with R and/or Python (and more) while earning their degree. This reduces the ramp time to get folks acclimated and up to speed. To fill the remaining skill set gap, they can use the vast libraries of work already provided by the R / Python initiatives or the many other data science communities available online for free as a starting point, which also minimizes the time due to unnecessary cycles and rework trying to define drivers based on gut feel only.
- Change: this is the bigger objection that has to be handled according to the business culture and openness to change. Best means of handling this is to simply show them. Proof is in the proverbial pudding so creating a variance analysis of the ML forecast, the human forecast and the actuals will speak volumes, and bonus points if the correlation and clustering analysis also surfaced previously unknown nuggets of information richness.
Even without the finding the golden nugget ticket, the CFO will certainly take notice of a more accurate forecast and appreciate the time and frustration savings from a less consuming budget and planning cycle.
Utilizing #PredictiveAnalytics & #BigData To Improve Accuracy of #EPM Forecasting Process
I was amazed when I read the @TidemarkEPM awesome new white paper on the “4 Steps to a Big Data Finance Strategy.” This is an area I am very passionate about; some might say, it’s become my soap-box since my days as a Business Intelligence consultant. I saw the dawn of a world where EPM, specifically, the planning and budgeting process was elevated from gut feel analytics to embracing #machinelearning as a means of understanding which drivers are statistically significant from those that have no verifiable impact , and ultimately using those to feed a more accurate forecast model.
Traditionally (even still today), finance teams sit in a conference room with Excel spreadsheets from Marketing, Customer Service etc., and basically, define the current or future plans based on past performance mixed with a sprinkle of gut feel (sometimes, it was more like a gallon of gut feel to every tablespoon of historical data). In these same meetings just one quarter later, I would shake my head when the same people questioned why they missed their targets or achieved a variance that was greater/less than the anticipated or expected value.
The new world order of Big Data Finance leverages the power of machine learned algorithms to derive true forecasted analytics. And this was a primary driver for my switching from a pure BI focus into data science. And, I have seen so many companies embrace the power of true “advanced predictive analytics” and by doing so, harness the value and benefits of doing so; and doing so, with confidence, instead of fear of this unknown statistical realm, not to mention all of the unsettled glances when you say the nebulous “#BigData” or “#predictiveAnalytics” phrases.
But I wondered, exactly how many companies are doing this vs. the old way? And I was very surprised to learn from the white-paper that 22.7% of people view predictive capabilities as “essential” to forecasting, with 52.2% claiming it nice to have. Surprised is an understatement; in fact, I was floored.
We aren’t just talking about including weather data when predicting consumer buying behaviors. What about the major challenge for the telecommunications / network provider with customer churn? Wouldn’t it be nice to answer the question: Who are the most profitable customers WHO have the highest likelihood of churn? And wouldn’t it be nice to not have to assign 1 to several analysts xx number of days or weeks to be able to crunch through all of the relevant data to try to get to an answer to that question? And still probably not have all of the most important internal indicators or be including indicators that have no value or significance to driving an accurate churn outcome?
What about adding in 3rd party external benchmarking data to further classify and correlate these customer indicators before you run your churn prediction model? To manually do this is daunting and so many companies, I now hypothesize, revert to the old ways of doing the forecast. Plus, I bet they have a daunting impression of the cost of big data and the time to implement because of past experiences with things like building the uber “data warehouse” to get to that panacea of the “1 single source of truth”…On the island of Dr. Disparate Data that we all dreamt of in our past lives, right?
I mean we have all heard that before and yet, how many times was it actually done successfully, within budget or in the allocated time frame? And if it was, what kind of quantifiable return on investment did you really get before annual maintenance bills flowed in? Be honest…No one is judging you; well, that is, if you learned from your mistakes or can admit that your pet project perhaps bit off too much and failed.
And what about training your people or the company to utilize said investment as part of your implementation plan? What was your budget for this training and was it successful, or did you have to hire outside folks like consultants to do the work for you? And by doing so, how long did it actually take the break the dependency on those external resources and still be successful?
Before the days of Apache Spark and other Open Source in-memory or streaming technologies, the world of Big Data was just blossoming into what it was going to grow into as a more mature flower. On top of which, it takes a while for someone to fully grok a new technology, even with the most specialized training, especially if they aren’t organically a programmer, like many Business Intelligence implementation specialists were/are. That is because those who have past experience with something like C++, can quickly apply the same techniques to newer technologies like Scala for Apache Spark or Python and be up and running much faster vs. someone who has no background in programming trying to learn what a loop is or how to call an API to get 3rd party benchmarking data. We programmers take that for granted when applying ourselves to learning something new.
And now that these tools are more enterprise ready and friendly with new integration modules with tools like R or MATLib for the statistical analysis coupled with all of the free training offered by places like University of Berkeley (via eDX online), now is the time to adopt Big Data Finance more than ever.
In a world where the machine learning algorithm can be paired with traditional classification modeling techniques automatically, and said algorithms have been made publicly available for your analysts to use as a starting point or in their entirety for your organization, one no longer needs to be daunted by thought of implementing Big Data Finance or testing out the waters of accuracy to see if you are comfortable with the margin of error between your former forecasting methodology and this new world order.
2015 Gartner Magic Quadrant – Boundaries Blur Between BI & Data Science
2015 Magic Quadrant Business intelligence
…a continuing trend which I gladly welcome…
IT WAS the best of times, it was the worst of times, it was the age of wisdom, it was the age of foolishness, it was the epoch of belief, it was the epoch of incredulity, it was the season of Light, it was the season of Darkness, it was the spring of hope, it was the winter of despair, we had everything before us, we had nothing before us…
–Charles Dickens

Truer words were never spoken, whether about the current technological times or deep in our past (remember the good ole enterprise report books, aka the 120 page paper weight?)
And, this data gal couldn’t be happier with the final predictions made by Gartner in their 2015 Magic Quadrant Report for Business Intelligence. Two major trends / differentiators fall right into the sweet spot I adore:
New demands for advanced analytics
Focus on predictive/prescriptive capabilities
Whether you think this spells out doom for business intelligence as it exists today or not, you cannot deny that these trends in data science and big data can only force us to finally work smarter, and not harder (is that even possible??)
What are your thoughts…?
KPIs in Retail & Store Analytics
I like this post. While I added some KPIs to their list, I think it is a good list to get retailers on the right path…
KPIs in Retail and Store Analytics (continuation of a post made by Abhinav on kpisrus.wordpress.com:
A) If it is a classic brick and mortar retailer:Retail / Merchandising KPIs:
-Average Time on Shelf
-Item Staleness
-Shrinkage % (includes things like spoilage, shoplifting/theft and damaged merchandise)
Marketing KPIs:
-Coupon Breakage and Efficacy (which coupons drive desired purchase behavior vs. detract)
-Net Promoter Score (“How likely are you to recommend xx company to a friend or family member” – this is typically measured during customer satisfaction surveys and depending on your organization, it may fall under Customer Ops or Marketing departments in terms of responsibility).
-Number of trips (in person) vs. e-commerce site visits per month (tells you if your website is more effective than your physical store at generating shopping interest)
B) If it is an e-retailer :
Marketing KPIs:
-Shopping Cart Abandonment %
-Page with the Highest Abandonment
-Dwell time per page (indicates interest)
-Clickstream path for purchasers (like Jamie mentioned do they arrive via email, promotion, flash sales source like Groupon), and if so, what are the clickstream paths that they take. This should look like an upside down funnel, where you have the visitors / unique users at the top who enter your site, and then the various paths (pages) they view in route to a purchase).
-Clickstream path for visitors (take Expedia for example…Many people use them as a travel search engine but then jump off the site to buy directly from the travel vendor – understanding this behavior can help you monetize the value of the content you provide as an alternate source of revenue).
-Visit to Buy %
-If direct email marketing is part of your strategy, analyzing click rate is a close second to measuring conversion rate. 2 different KPIs, one the king , the other the queen and both necessary to understand how effective your email campaign was and whether it warranted the associated campaign cost.
Site Operations KPIs / Marketing KPIs:
-Error % Overall
-Error % by Page (this is highly correlated to the Pages that have the Highest Abandonment, which means you can fix something like the reason for the error, and have a direct path to measure the success of the change).
Financial KPIs:
-Average order size per transaction
-Average sales per transaction
-Average number of items per transaction
-Average profit per transaction
-Return on capital invested
-Margin %
-Markup %
I hope this helps. Let me know if you have any questions.
You can reach me at mailto://lauraedell@me.com or you can visit my blog where I have many posts listing out various KPIs by industry and how to best aggregate them for reporting and executive presentation purposes ( http://www.lauraedell.com ).

It was very likely that I would write on KPIs in Retail or Store Analytics since my last post on Marketing and Customer Analytics. The main motive behind retailers looking into BI is ‘customer’ and how they can quickly react to changes in customer demand, rather predict customer demand, remove wasteful spending by target marketing, exceeding customer expectation and hence improve customer retention.

I did a quick research on what companies have been using as a measure of performance in retail industry and compiled a list of KPIs that I would recommend for consideration.
Customer Analytics
Customer being the key for this industry it is important to segment customers especially for strategic campaigns and to develop relationships for maximum customer retention. Understanding customer requirements and dealing with ever-changing market conditions is the key for a retail industry to survive the competition.
- Average order size per transaction
- Average sales per transaction
View original post 278 more words
Awesome Article “Views from the C-Suite: Who’s Big on Big Data” from The Economist
This is an awesome article discussing the whole “big data” thing from the C-level point of view. It is easy to get mired down in the technical weeds of big data, especially since it generates a ton of different definitions depending on who you ask and usually, where they work *department, wise*.
http://pages.platfora.com/rs/platfora/images/Economist-Intelligence-Unit-Big-Data-Exec-Summary.pdf
Let me know what you think.
Big shout out to @platfora for sharing this!
Finance is the Participation Sport of the BI Olympics
IT is no longer the powerhouse that it once was, and unfortunately for CIOs who haven’t embraced change, much of their realm was commoditized by cloud computing powered by the core principles of grid computational engines and schema-less database designs. The whole concept of spending millions of dollars to bring all disparate systems together into one data warehouse has proven modesty beneficial but if we are being truly honest, what has all that money and time actually yielded, especially towards the bottom line?
And by the time you finished with the EDW, I guarantee it was missing core operational data streams that were then designed into their own sea of data marts. Fast forward a few years, and you probably have some level of EDW, many more data marts , probably one or more cube (ROLAP/MOLAP) applications and n-number of cubes or a massive 1+ hyper-cube(s) and still, the business depends of spreadsheets to sit on top of these systems, creating individual silos of information under the desk or in the mind of one individual.
Wait<<<rewind<<< Isn’t that where we started?
Having disparate, ungoverned and untrusted data sources being managed by individuals instead of by enterprise systems of record?
And now we’re back>>>press play to continue>>>
When you stop to think about the last ten years, fellow BI practitioners, you might be scared of your ever-changing role. From a grass-roots effort to a formalized department team, Business Intelligence went from the shadows to the mainstream, and brought with it reports then dashboards, then KPIs and scorecards, managing by exception, proactive notifications and so on. And bam! We were hit by the first smattering of changes to come when Hadoop and others hit the presses. But we really didnt grok what the true potential and actual meaning of said systems unless you come from a background like myself, either competitively, or from a big data friendly industry group like telecommunications, or from a consultant/implementation p.o.v.
And then social networking took off like gang busters and mobile became a reality with the introduction of the tablet device (though, I hate to float my boat as always by mentioning my soap box dream spewed at a TDWI conference about the future of mobile BI when the 1st generation iPhone released).
But that is neither here nor there. And, as always, I digress and am back…
At the same time as we myopically focused on the technological changing landscape around us, a shifting power paradigm was building wherein the Finance organization, once relegated to the back partition of cubicles, where a pin drop was heard ’round the world (or at least, the floor), was growing more and more despondent with not being able to access the data they needed without IT intervention in order to update their monthly forecasts and produce their subsequent P&L, Balance Sheet and Cash Flow Planning statements. And IT’s response was to acquire (for additional millions of dollars) a “BI tool” aka an ad-hoc reporting application that would allow them to pull their own data. But it had been installed and the data had been pulled, and validated and by the time of completion, the Finance team had either found an alternate solution or found the system useful for a very small sliver of analysis but went outside of IT to get additional sources of information that wanted and needed to adapt to the changing business pressures from the convergence of social, mobile and unstructured datasets. And suddenly those once, shiny BI tools, seemed like antiquated relics, and simply could not handle the sheer data volumes that were now expected from it or would crash (unless filtered beyond the point of value). Businesses need not adapt their queries to the tool but need a tool that can adapt to their ever-changing processes and needed.

Drowning in data but starving for information…
So if necessity if the mother of invention, Finance was its well deserving child. And why? The business across the board is starving for information but drowning in data. And Finance is no longer a game of solitaire, understood by few and ignored by many. In fact, Finance has become the participation sport of the BI Olympics, and rightfully so, where departmental collaboration at the fringe of the organization has proven as the missing link that before prevented successful top-down planning efforts. Where visualizations demands made dashboards a thing of the past, and demanded and better story, vis-a-vie storylines / infographics, to help disseminate more than just the numbers, but the story behind the numbers to the rest of the organization, or what I like to call the “fringe”.
I remember a few years ago when the biggest challenge was getting data, and often, we joked about how nice it would be to have a sea of data to drown in; an analysts’ buffet-du-jour; a happy paralysis-induced-by said analysis plate was the special of the day, yet only for a few, while the rest was but a gleam in our data-starved eyes.
Looking forward from there, I ask, dear reader, where do we go from here…If it’s a Finance party and we are all invited, what do we bring to the party table as BI practitioners of value? Can we provide the next critical differentiator?
Well, I believe that we can, and that critical differentiator is forward-looking data. Why?
Gartner Group stated that “Predictive data will increase profitability by 20% and that historical data will become a thing of the past” (for a BI practitioner, the last part of that statement should worry you, if you are still resisting the plunge into the predictive analytics pool).
Remember, predictive is a process that allows an organization to get true insight and has been executed amongst a larger group of people to drive faster, smarter business users. This is perfect for enterprise needs because by definition, they offer a larger group of people to work with.
 In fact, it was Jack Welch would said “An organization’s ability to learn, and translate that learning into action rapidly, is the ultimate competitive advantage”
If you haven’t already, go out and started learning one of the statistical application packages. I suggest “R” and in the coming weeks, I will provide R and SAS scripts (I have experience with both) for those interested in growing their chosen profession and remaining relevant as we weather the sea of business changes
.
How Do You Use LinkedIn? (Social Media Infographics)

How often do you refresh your LinkedIn profile pic? Or worse, the content within your profile? Unless you are a sales exec trolling the social networking site or a job seeker, I would surmise not that often; in fact, rarely is most apropos of a description. Thoughts…? ( yes, she’s back ( again), but this time, for good dear readers…@Laura_E_Edell (#infographics) says thanks to designinfographics.com for her latest content postings!
And just because I call it out, doesn’t mean you will know the best approach to updating your LinkedIn profile. And guess what …there’s an infographic for that! (http://www.linkedin.com/in/lauraerinedell)

Check out my profile on LinkedIn by clicking infographic
Futures According to Laura… Convergence of Cloud and Neural Networking with Mobility and Big Data
It’s been longer and longer between my posts and as always, life can be inferred as the reason for my delay.
But I was also struggling with feeling a sense of “what now” as it relates to Business Intelligence.
Many years ago, when I first started blogging, I would write about where I thought BI needed to move in order to remain relevant in the future. And those futures have come to fruition lately. Gamuts ranging from merging social networking datasets into traditional BI frameworks to a more common use case of applying composite visualizations to data (microcharts, as an example). Perhaps more esoteric was my staunch stance on the Mobile BI marriage which when iPhone 1 was released was a future many disputed with me. In fact, most did not own the first release of the iPhone, and many were still RIM subscribers. And it was hard for the Blackberry crowd to fathom a world unbounded by keyboards and scroll wheels and how that would be a game changer for mobile BI. And of course, once the iPad was introduced, it was a game over moment. Execs everywhere wanted their iPads to have the latest and greatest dashboards/KPIs/apps. From Angry Birds to their Daily Sales trend, CEOs and the like had new brain candy to distract them during those drawn out meetings. And instead of wanting that PDF or PowerPoint update, they wanted to receive the same data on their iPad. Once they did, they realized that having the “WHAT” is happening understanding was only the crack to get them hooked for a while. Unfortunately, the efficacy of KPI colors and related numbers only satisfies the one person show – but as we know, it isn’t the CEO who analyzes why a RED KPI indicator shows up. Thus, more levels of information (beyond the “WHAT” and “HOW OFTEN”) were needed to answer the “WHY” and “HOW TO FIX” the underlying / root cause issue.
The mobile app was born.
It is the reborn mobile dashboard that has been transformed into a new mobile workflow, more akin to the mobile app.
But it took time for people to understand the marriage between BI dashboards, the mobile wave, especially the game change that Apple introduced with it’s swipe and pinch to zoom gestures, the revolution of the App Stores for the “need to have access to it now” generation of Execs, the capability to write-back from mobile devices to any number of source systems and how functionally, each of these seemingly unrelated functions would and could be weaved together to create the next generation of Mobile Apps for Business Intelligence.
But that’s not what I wanted to write about today. It was a dream of the past that has come to fruition.
Coming into 2013, cloud went from being something that very few understood to another game changer in terms of how CIOs are thinking about application support of the future. And that future is now.
But there are still limitations that we are bound by. Either we have a mobile device or not, either it is on 3 or 4G or wifi. Add to that our laptops (yes, something I believe will not dominate the business world in a future someday). And compound that with other devices like smartphones, eReaders, desktop computers et al.
So, I started thinking about some of the latest research regarding Neural Networks (another set of posts I have made about the future of communication via Neural networks) published recently by Cornell University here (link points to http://arxiv.org/abs/1301.3605).
And my nature “plinko” thought process (before you ask, search for the Price is Right game and you will understand “Plinko Thoughts”) bounced from Neural Networks to Cloud Networks and from Cloud Networks to the idea of a Personal Cloud.
A cloud of such personal nature that all of our unique devices are forever connected in our own personal sphere and all times when on our person. We walk around and we each have our own personal clouds. Instead of a mass world wide web, we have our own personal wide area network and our own personal wide web.
When we interact with other people, those people can choose to share their Personal networks with us via Neural Networking or some other sentient process, or in the example, where we bump into a friend and we want to share details with them, all of our devices have the capability to interlink to each other via our Personal Clouds.
Devices are always connected to your Personal Cloud which is authenticated to your person, so that passwords which are already reaching their shelf life (see: article for more information on this point), are no longer the annoying constraint when we try to seamlessly use our mobile devices while on the go. Instead, they are authenticated to our Personal Cloud following similar principles as where IAM (Identity and Access Management) is moving towards in future. And changes in IAM are not only necessary for this idea to come to fruition but are on the horizon.
In fact, Gartner published an article in July 2012, called “Hype Cycle for Identity and Access Management Technologies, 2012” in which Gartner recognized that the growing adoption of mobile devices, cloud computing, social media and big data were converging to help drive significant changes in the identity and access management market.
For background purposes, IAM processes and technologies work across multiple systems to manage:
■ Multiple digital identities representing individual users, each comprising an identifier (name or key) and a set of data that represent attributes, preferences and traits
■ The relationship of those digital identities to each user’s civil identity
■ How digital user identities communicate or otherwise interact with those systems to handle
information or gain knowledge about the information contained in the systems
If you extrapolate that 3rd bullet out, and weave in what you might or might not know/understand about Neural Networking or brain-to-brain communication (see recent Duke findings by Dr. Miguel Nicolelis here) (BTW – the link points to http://www.nicolelislab.net/), one can start to fathom the world of our future. Add in cloud networking, big data, social data and mobility, and perhaps, the Personal Cloud concept I extol is not as far fetched as you initially thought when you read this post. Think about it.
My dream like with my other posts is to be able to refer back to this entry years from now with a sense of pride and “I told you so.”
Come on – any blogger who makes predictions which come true years later deserves some bragging rites.
Or at least, I think so…
MicroStrategy World 2012 – Miami
Our internal SKO (sales kick off) meeting was the beginning of this years’ MSTR World conference ( held in Miami, FL at the Intercontinental Hotel located on Chopin Plaza). As with every year, the kickoff meeting is the preliminary gathering of the salesforce in an effort to “rah-rah” the troops who work the front lines around the world ( myself included).
What I find most intriguing is the fact that MicroStrategy is materializing for BI all of those pipe dreams we ALL have. You know the ones I mean : I didn’t buy socialintelligence.co for my health several years ago. It was because I saw the vision of a future where business intelligence and social networking were married. Or take cloud intelligence, aka BI in the cloud. Looking back in 2008, I remember my soapbox discussion of BI mashups, ala My Google, supported in a drag and drop off premises environment. And everyone hollered that I was too visionary, or too far ahead. That everyone wanted reporting, and if I was lucky, maybe even dashboards.
But the acceleration continued, whether adoption grew or not.
Then, i pushed the envelope again: I wanted to take my previous thought of the mashup a morph it into an app integrated with BI tools. Write back to transactional systems or web services was key.
What is a dashboard without the ability within the same interface to take action? Everyone talks about actionable metrics/KPIs. Well, I will tell you that to have a KPI BY DEFINITION OF WHAT A KPI IS, means it is actionable.
But making your end users go to a separate ERP or CRM, to make the changes necessary to affect a KPI, will drive your users away. What benefit can you offer them in that instance ? Going to a dashboard or an excel sheet is no different. It is 1 application to view and if they are lucky, to analyze their data. If they were using excel before , they will still be using excel, especially if your dashboard isn’t useful to day to day operations.
Why? They still have to go to a 2nd application to take action.
Instead, integrate them into one.
Your dashboard will become meaningful and useful to the larger audience of users.
Pipe dream right?
NO. I have proved this out many times now and it works.
Back in 2007-2008, it was merely a theory I pontificated with you, my dear readers.
Since then, I have proved it out several times over and proven the success that can be achieved by taking that next step with your BI platforms.
Folks, if you haven’t done it, do it. Don’t waste anymore time. It took me less then 3 days to write the web services code to consume the salesforce APIs including chatter, ( business “twitter” according to SFDC), into my BI dashboard ( mobile dashboard in fact).
And suddenly, a sales dashboard becomes relevant. No longer does the salesforce team have to view their opportunities and quota achievement in one place, only to leave or open a new browser, to access their salesforce.com portal in order to update where they are at mid quarter.
But wait, now they forgot which KPIs they need to add comments to because they were red on the dashboard which is now closed, and their sales GM is screaming at them on the phone. Oh wait…they are on the road while this is happening and their data plan for their iPad has expired and no wireless connection is found.
What do you do?
Integrating salesforce.com into their dashboard eliminates at least one step (opening a new browser) in the process. Offering mobile offline transactions is a new feature of MicroStrategy’s mobile application. This allows those sales folks to make the comments they need to make while offline, on the road , which will be queued until they are online again.
One stop, one dashboard to access and take action through, even when offline, using their mobile ( android, iPad/iPhone or blackberry ) device.
This is why I’m excited to see MicroStrategy pushing the envelope on mobile BI futures.
MicroStrategy Personal Cloud – a Great **FREE** Cloud-based, Mobile Visualization Tool
Have you ever needed to create a prototype of a larger Business Intelligence project focused on data visualizations? Chances are, you have, fellow BI practitioners. Here’s the scenario for you day-dreamers out there: 
OK, and now We are back…rewind to sentence 1 –
Prototyping is to dashboard design or any data visualization design as pencils and grid paper are to me. Mano y mano – I mean, totally symbiotic, right?
But, wireframing is torturous when you are in a consultative or pre-sales role, because you can’t present napkin designs to a client, or pictures of a whiteboard, unless you are showing them the process behind the design. (And by the way, this is an effective “presentation builder” when you are going for a dramatic effect –> ala “first there were cavemen, then the chisel and stone where all one had to create metrics –> then the whiteboard –> then the…wait!
This is where said BI practitioner needs to have something MORE for that dramatic pop, whiz-AM to give to their prospective clients/customers in their leave behind presentation.
And finally, the girl gets to her point (you are always so patient, my loving blog readers)…While I biased, if you forget whom I work for, and just take into account the tool, you will see the awesomeness that the new MicroStrategy Personal Cloud is for (drum roll please) PROTOTYPING a new dashboard — or just building, distributing, mobilizing etc your spreadsheet of data in a highly stylized, graphical means that tell a story far better than a spreadsheet can in most situations. (Yes, neighseyers, I know that for the 5% of circumstances which you can name, a spreadsheet is more àpropos, but HA HA, I say: this cloud personal product has the ability to include the data table along with the data visualizations!)
Best of all it is free.
I demoed this recently and was able to time it took to upload and spreadsheet, render 3 different data visualizations, generate the link to send to mobile devices (iPads and iPhones), network latency for said demo-ees to receive the email with the link and for them to launch the dashboard I created, and guess what the total time was?
Next best of all, it took only 23.7 minutes from concept to mobilization!
Mind you, I was also using data from the prospect that I had never seen or had any experience with.
OK, here is how it was done:
1) Create a FREE account or login to your existing MicroStrategy account (by existing, I mean, if you have ever signed up for the MicroStrategy forums or discussion boards, or you are an employee, then use the same login) at https://www.microstrategy.com/cloud/personal

Landing Page After Logged in to Personal Cloud
2) Click the button to Create New Dashboard:

Create Dashboard Icon
- Now, you either need to have a spreadsheet of data OR you can choose one of the sample spreadsheets that MicroStrategy provides (which is helpful if you want to see how others set up their data in Excel, or how others have used Cloud personal to create dashboards; even though it is sample data , it is actually REAL data that has been scrub-a-dub-dubbed for your pleasure!) If using a sample data set, I recommend the FAA data. It is real air traffic data, with carrier, airport code, days of the week, etc, which you can use to plan your travel by; I do…See screenshot below. There are some airports and some carriers who fly into said airports whom I WILL not fly given set days of the week in which I must travel. If there is a choice, I will choose to fly alternate carriers/routes. This FAA data set will enable you to analyze this information to make the most informed decision (outside of price) when planning your travel. Trust me…VERY HELPFUL! Plus, you can look at all the poor slobs without names sitting at the Alaska Air gate who DIDNT use this information to plan their travel, and as you casually saunter to your own gate on that Tuesday between 3 – 6 PM at SeaTac airport , you will remember that they look so sad because their Alaska Air flight has a 88% likelihood of being delayed or cancelled. (BTW, before you jump on me for my not so nice reference to said passengers), it is merely a quotation from my favorite movie ‘Breakfast at Tiffany’s’ …says Holly Golightly: “Poor cat…poor old slob without a name”.

On time Performance (Live FAA Data)
If using your own data, select the spreadsheet you want to upload
3) Preview your data; IMPORTANT STEP: make sure that you change any fields which to their correct type (either Attribute or Metric or Do Not Import).

Cloud Import - Preview Data
Keep in mind the 80/20 rule: 80% of the time, MicroStrategy will designate your data as either an Attribute or Metric correctly using a simple rule of thumb: Text or VarChar/NVarChar if using SQL Server, will always be designated as an Attribute (i.e. your descriptor/Dimension) and your numerals designated as your Metrics. BUT, if your spreadsheet uses ID fields, like Store ID, or Case ID, along with the descriptor like Store DESC or Case DESC, most likely MicroStrategy will assume the Store ID/Case ID are Metrics (since the fields are numeric in the source). This is an Easy Change! You just need to make sure ahead of time to make that change using the drop down indicator arrows in the column headings – To find them, hover over the column names with your mouse icon until you see the drop down indicator arrow. Click on the arrow to change an Attribute column to a Metric column and vice-versa (see screenshot):

Change Attribute to Metric
Once you finish with previewing your data, and everything looks good, click OK at the bottom Right of your screen.
In about 30-35 seconds, MicroStrategy will have imported your data into the Cloud for you to start building your awesome dashboards.
4) Choose a visualization from the menu that pops up on your screen upon successfully importing your spreadsheet:

Change data visualization as little or as often as you choose
Here is the 2010 NFL data which I uploaded this morning. It is a heatmap showing the Home teams as well as any teams they played in the 2010 season. The size of the box is HOW big the win or loss was. The color indicates whether they won or lost (Green = Home team won // Red = Home team lost).
For all you, dear readers, I bid you a Happy New Year. May your ideas flow a plenty, and your data match your dreams (of what it should be) :). Go fearlessly into the new world order of business intelligence, and know that I , Laura E. your Dashboard Design Diva, called Social Intelligence the New Order, in 2005, again in 2006 and 2007. 🙂 Cheers, ya’ll.
Business Intelligence Clouds – The Skies the Limit
I am back…(for now, or so it seems these days) – I promise to get back to one post a month if not more.
Yes, I am known for my frequent use of puns, bordering on the line between cheesy and relevant. Forgive the title. It has been over 110 days since I last posted, which for me is a travesty. Despite my ever growing list of activities both professional and personally, I have always put my blog in the top priority quadrant.
Enough ranting…I diverged; and now I am back.
Ok, cloud computing (BI tools related) seems to be all the rage. Right up there with Mobile
BI, big data and social. I dare use my own term coined back in 2007 ‘Social Intelligence’ as now others have trade marked this phrase (but we, dear readers, know the truth –> we have been thinking about the marriage between social networks / social media data sets and business intelligence for years now)…Alas, I diverge again. Today, I have been thinking a lot about cloud computing and Business Intelligence.
Think about BI and portals, like Sharepoint (just to name 1)…It was all of the rage (or perhaps, still is)…”Integrate my BI reporting with my intranet / portal /Sharepoint web parts…OK, once that was completed successfully, did it buy much in terms of adoption or savings or any number of those ROI / savings catch – “Buy our product, and your employees will literally save so much time they will be basket weaving their reports into TRUE analysis'” What they didnt tell you, was that more bandwidth meant less need for those people, which in turn, meant people went into scarcity mode/tactics trying to make themselves seem or be relevant…And I dont fault them for this…Companies were not ready or did not want to think about what they were going to do with the newly freed up resources that they would have when the panacea of BI deployments actually came to fruition…And so, the wheel turned. What was next…? Reports became dashboards; dashboards became scorecards (became the complements for the former); Scorecards introduced proactive notification / alerting; alerting introduced threshold based notification across multiple devices/methods, one of which was mobile; mobile notification brought the need for mobile BI –> and frankly, and I will say it: Apple brought us the hardware to see the latter into fruition…Swipe, tap, double tap –> drill down was now fun. Mobile made portals seem like child’s play. But what about when you need to visualize something and ONLY have it on a spreadsheet?
(I love hearing this one; as if the multi-billion dollar company whose employee is claiming to only have the data on a spreadsheet didnt get it from somewhere else; I know, I know –> in the odd case, yes, this is true…so I will play along)…
The “only on a spreadsheet” crowd made mobile seem restrictive; enter RoamBI and the likes of others like MicroStrategy (yes, MicroStrategy now has a data import feature for spreadsheets with advanced visualizations for both web and mobile)…Enter Qlikview for the web crowd. The “I’m going to build-a dashboard in less than 30 minutes” salesforce “wait…that’s not all folks….come now (to the meeting room) with your spreadsheet, and watch our magicians create dashboards to take with you from the meeting”
But no one cared about maintenance, data integrity, cleanliness or accuracy…I know…they are meant to be nimble, and I see their value in some instances and some circumstances…Just like the multi-billion dollar company who only tracks data on spreqadsheets…I get it; there are some circumstances where they exist…But, it is not the norm.
So, here we are …mobile offerings here and there; build a dashboard on the fly; import spreadsheets during meetings; but, what happens when you go back to your desk and have to open up your portal (still) and now have a new dashboard that only you can see unless you forward it out manually?
Enter cloud computing for BI; but not at the macro scale; let’s talk , personal…Personal clouds; individual sandboxes of a predefined amount of space which IT has no sanction over other than to bless how much space is allocated…From there, what you do with it is up to you; Hackles going up I see…How about this…

- Image via CrunchBase
Salesforce.com –> The biggest CRM cloud today. And for the last many years, SFDC has
enbraced Cloud Computing. And big data for that matter; and databases (database.com in fact) in the cloud…Lions and tigers and bears, oh my!
So isnt it natural for BI to follow CRM into cloud computing ?? Ok, ok…for those of you whose hackles are still up, some rules (you IT folks will want to read further):
Rules of the game:
1) Set an amount of space (not to be exceeded; no matter what) – But be fair and realistic; a 100 MB is useless; in today’s world, a 4 GB zip drive was advertised for $4.99 during the back to school sales, so I think you can pony up enough to help make the cloud useful.
2) If you delete it, there is a recycling bin (like on your PC/Mac); if you permanently delete it, too bad/so sad…We need to draw the line somewhere. Poor Sharepoint admins around the world are having to drop into STSADM commands to restore Alvin Analyst’s Most Important Analysis that he not only moved into recycling bin but then permanently deleted.
3) Put some things of use in this personal cloud at work like BI tools; upload a spreadsheet and build a dashboard in minutes wiht visualizations like the graph matrix (a crowd pleasure) or a time series slider (another crowd favorite; people just love time based data 🙂 But I digress (again)…
4) Set up BI reporting on the logged events; understand how many users are using your cloud environment; how many are getting errors; what and why are they getting errors; this simple type of event based logging is very informative. (We BI professionals tend to overthink things, especially those who are also physicists).
5) Take a look at what people are using the cloud for; if you create and add meaningful tools like BI visualizations and data import and offer viewing via mobile devices like iPhone/iPad and Android or web, people will use it…
This isnt a corporate iTunes or MobileMe Cloud; this isnt Amazon’s elastic cloud (EC2). This is a cloud wiht the sole purpase of supporting BI; wait, not just supporting, but propelling users out of the doldrums of the current state of affairs and into the future.
It’s tangible and just cool enough to tell your colleagues and work friends “hey, I’ve got a BI cloud; do you?”
BIPlayBook.Com is Now Available!
As an aside, I’m excited to announce my latest website: http://www.biplaybook.com is finally published. Essentially, I decided that you, dear readers, were ready for the next step. What comes next, you ask?
After Measuring BI data –> Making Measurements Meaningful –> and –>Massaging Meaningful Data into Metrics, what comes next is to discuss the age-old question of ‘So What’? & ‘What Do I Do About it’?
BI PlayBook offers readers the next level of real-world scenarios now that BI has become the nomenclature of yesteryear & is used by most to inform decisions. Basically, it is the same, with the added bonus of how to tie BI back into the original business process, customer service/satisfaction process or really any process of substance within a company.
This is quite meaningful to me because so often, as consumers of goods and services, we find our voices go unheard, especially when we are left dissatisfied. Can you muster the courage to voice your issue (dare I say, ‘complain’?) using the only tools provided: poor website feedback forms, surveys or (gasp) relaying our issue by calling into a call center(s) or IVR system (double gasp)? I don’t know if I can…
How many times do we get caught in the endless loop of an IVR, only to be ‘opted-out’ (aka – hung up on) when we do not press the magical combination of numbers on our keypads to reach a live human being, or when we are sneaky, pressing ‘0’ only to find out the company is one step ahead of us, having programmed ‘0’ to automatically transfer your call to our friend: ‘ReLisa Boutton’ – aka the Release Button().
Feedback is critical, especially as our world has become consumed by social networks. The ‘chatter’ of customers that ensues, choosing to ‘Like’ or join our company page or product, or tweet about the merits or demerits of one’s value proposition, is not only rich if one cares about understanding their customer. But, it is also a key into how well you are doing in the eyes of your customer. Think about how many customer satisfaction surveys you have taken ask you whether or not your would recommend a company to a friend or family member.
This measure defines one’s NPR, or Net Promoter Rank, and is a commonly shared KPI or key performance indicator for a company.
Yet, market researchers like myself know that what a customer says on a survey isn’t always how they will behave. This discrepancy between what someone says and what someone does is as age-old as our parents telling us as children “do not as I do, but as I say.” However, no longer does this paradigm hold true. Therefore, limiting oneself by their NPR score will restrict the ability to truly understand one’s Voice of the Customer. And further, if you do not understand your customer’s actual likelihood to recommend to others or repeat purchase from you, how can you predict their lifetime value or propensity for future revenue earnings? You can’t.
Now, I am ranting. I get it.
But I want you to understand that social media content that is available from understanding the social network spheres can fill that gap. They can help you understand how your customers truly perceive your goods or services. Trust me, customers are more likely to tweet (use Twitter) to vent in 140 characters or less about a negative experience than they are to take the time to fill out a survey. Likewise, they are more likely to rave about a great experience with your company.
So, why shouldn’t this social ‘chatter’ be tied back into the business intelligence platforms, and further, mined out specifically to inform customer feedback loops, voice of the customer & value stream maps, for example?
Going one step further, having a BI PlayBook focuses the attention of the metric owners on the areas that needs to be addressed, while filtering out the noise that can detract from the intended purpose.
If we are going to make folks responsible for the performance of a given metric, shouldn’t we also help them understand what is expected of them up front, as opposed to when something goes terribly wrong, signified by the “text message” tirade of an overworked CEO waking you out of your slumber at 3 AM?
Further, understanding how to address an issue, who to communicate to and most importantly, how to resolve and respond to affected parties are all part of a well conceived BI playbook.
It truly takes BI to that next level. In fact, two years ago, I presented this very topic at the TDWI Executive Summit in San Diego (Tying Business Processes into your Business Intelligence). While I got a lot of stares ala ‘dog tilting head to the side in that confused glare at owner look’, I hope people can draw back on that experience with moments of ‘ah ha – that is what she meant’ now that they have evolved ( a little) in their BI maturation growth.
Gartner BI Magic Quadrant 2011 – Keeping with the Tradition

Gartner Magic Quadrant 2011
I have posted the Gartner Business Intelligence ‘BI’ Magic Quadrant (in addition to the ETL quadrant) for the last several years. To say that I missed the boat on this year’s quadrant is a bit extreme folks, though for my delay, I am sorry. I did not realize there were readers who counted on me to post this information each year. I am a few months behind the curve on getting this to you, dear readers. But, what that said, it is better late, than never, right?
Oh, and who is really ‘clocking’ me anyway, other than myself? But that is a whole other issue for another post, some other day.
As an aside, am excited to say that my latest websites http://www.biplaybook.com is finally published. Essentially, I decided that the next step after Measuring BI data, Making the Measurements Meaningful, and Modifying Meaningful Data into Metrics was to address the age old question of ‘So What’? Or ‘What Do I Do About it’?
BI PlayBook offers readers real-world scenarios that I have solved using BI or data visualizations of sorts, but with the added bonus, of how to tie it back into the original business process you were reporting on or trying to help with BI, or tie back into the customer services/satisfaction process. This latter one is quite meaningful to me, because so often, we find our voices go unheard, especially when we complain to large corporations via website feedback, surveys or (gasp) calling into their call center(s). Feedback should be directly tied back into the performance being measured whether it is operational, tactical, managerial, marketing, financial, retail , production and so forth. So, why not tie that back into your business intelligence platforms using feedback loops and voice of the customer maps /value stream maps to do so.
Going one step further, having a BI PlayBook allows end users of your BI systems who are signed up and responsible for metrics being visualized and reported out to the company to know what they are expected to do to address a problem with that metric, who they are to communicate both the issue and the resolution to, and what success looks like.
Is it really fair of us, BI practitioners, to build and assign responisble ownership to our leaders of the world, without giving them some guidance (documented of course), on what to do about these new responsibilities? We are certainly the 1st to be critical when a ‘red’ issue shows up on one of our reports/dashboards/visualizations. How cool would it be to look at these red events, see the people responsible getting alerted to said fluctation, and further, seeing said person take appropriate and reasonable steps towards resolution? Well, a playbook offers the roadmap or guidance around this very process.
It truly takes BI to that next level. In fact, two years ago, I presented this very topic at the TDWI Executive Summit in San Diego (Tying Business Processes into your Business Intelligence). The PlayBook is the documented ways and means to achieve this outcome in a real-world situation.
To Start Quilting, One Just Needs a Set of Patterns: Deconstructing Neural Networks (my favorite topic de la journée, semaine ou année)
How a Neural Network Works:
 A neural network (#neuralnetwork) uses rules it “learns” from patterns in data to construct a hidden layer of logic. The hidden layer then processes inputs, classifying them based on the experience of the model. In this example, the neural network has been trained to distinguish between valid and fraudulent credit card purchases.
This is not your mom’s apple pie or the good old days of case-based reasoning or fuzzy logic. (Although, the latter is still one of my favorite terms to say. Try it: fuzzzzyyyy logic. Rolls off the tongue, right?)…But I digress…
And, now, we’re back.
To give you a quick refresher:

Case based reasoning represents knowledge as a database of past cases and their solutions. The system uses a six-step process to generate solutions to new problems encountered by the user.
We’re talking old school, folks…Think to yourself, frustrating FAQ pages, where you type a question into a search box, only to have follow on questions prompt you for further clarification and with each one, further frustration. Oh and BTW, the same FAQ pages which e-commerce sites laughably call ‘customer support’ –
“ And, I wonder why your ASCI customer service scores are soo low Mr. or Mrs. e-Retailer :),” says this blogger facetiously, to her audience .
And, we’re not talking about fuzzy logic either – Simply put, fuzzy logic is fun to say, yes, and technically is:

–> Rule-based technology with exceptions (see arrow 4)
–> Represents linguistic categories (for example, “warm”, “hot”) as ranges of values
–> Describes a particular phenomenon or process and then represents in a diminutive number of flexible rules
–> Provides solutions to scenarios typically difficult to represent with succinct IF-THEN rules
(Graphic: Take a thermostat in your home and assign membership functions for the input called temperature. This becomes part of the logic of the thermostat to control the room temperature. Membership functions translate linguistic expressions such as “warm” or “cool” into quantifiable numbers that computer systems can then consume and manipulate.)
Nope, we are talking Neural Networks – the absolute Bees-Knees in my mind, right up there with social intelligence and my family (in no specific order :):
–> Find patterns and relationships in massive amounts of data that are too complicated for human to analyze
–> “Learn” patterns by searching for relationships, building models, and correcting over and over again model’s own mistakes
–> Humans “train” network by feeding it training data for which inputs produce known set of outputs or conclusions, to help neural network learn correct solution by example
–> Neural network applications in medicine, science, and business address problems in pattern classification, prediction, financial analysis, and control and optimization
Remember folks: Knowledge is power and definitely an asset. Want to know more? I discuss this and other intangibles further in part 1 of a multi-part study I am conducting called:
 Measuring Our Intangible Assets, by Laura Edell

Investigative Analysis Part 1: Quantifying the Market Value of an Organization’s Intangible Asset Known as ‘Knowledge’
OK, so I’ve decided to conduct another multi-part study similar to what I did last year.
This time, I will be analyzing and attempting the quantify an organization’s intangible assets. Specifically, the following:
• knowledge, brands, reputations, and unique business processes
So, starting with knowledge: Firstly, the chart is a little outdated but I will source the last two years and updated the graph later in the series. Regardless, it is interesting none-the-less. And since I am the Queen advocate for measuring what matters and managing what you can measure, then consider the following my attempt to drink my own cool-aid – the following chart depicts revenue growth over a 7 year period ending in 2008 – Those of you, my dear readers, who are also fellow Business Intelligence practitioners, should be able to attest at first glance to this statistical representation of Content Management Systems (CMS) and Portals YoY Revenue growth.
In fact, many of us have been asked to integrate BI dashboards and reports into existing corporate portals, like Microsoft SharePoint or into the native portals bundled with most Enterprise grade BI products like MicroStrategy or SAP/Business Objects, right? Many of us have been tasked with drafting data dictionaries, data governance documentation, source protected project and code repositories; ie – knowledge capture areas. But even in my vast knowledge (no pun intended), I was unaware that the growth spurt specific to CMS’ was as dramatic as this, depicted below and sourced from Prentice Hall
 In fact, between 2001 and 2008, CMS’ revenue growth went from ~$2.5B to ~$22B, with the greatest spurt beginning in 2003 and skyrocketing up from there.
Conversely, the portal revenue growth was substantially less. This was a surprise. I must have heard the words SharePoint and Implementation more than any other between 2007 – 2009, whereas the sticker shock that came with an enterprise grade CMS sent many a C-level into the land of Nod, never to return until the proven VALUE cloud could ride them home against the nasty cop known as COST.
Aah – Ha moment, folks. Portal products were far less costly than the typical Documentum or IBM CMS.’
In fact, Jupiter’s recent report on CMS’ stated
“In some cases, an organization will deploy several seemingly redundant systems. In our sampling of about 800 companies that use content management packages, we discovered that almost 15 percent had implemented more than one CMS, often from competing vendors. That’s astounding, especially when you consider that an organization that deploys two content management systems can rack up more than $1 million in licensing fees and as much as $300,000 in yearly maintenance costs. Buying a second CMS should certainly raise a red flag for any CIO or CFO about to approve a purchase order.”
That’s 120 companies from the Jupiter study spending $1M in licensing, or $120M baseline. Extend that to all organizations leveraging CMS technology and therein lies the curious case of the revenue growth spurt.
To that, I say, Kiss My Intangible Assets! Knowledge is power, except when parked in someone’s head – Now, when will someone invent the physical drainage system for exactly said knowledge with or without permission of said holder? This gatekeepers need to go, and are often the dinosaurs fearing the newbie college grads and worst of all, CHANGE.
In part 2, we will discuss another fave of mine: Brand You!
Gartner VP Addresses Prerequisites for Developing Corporate Social Media Policies
Carol Rozwell might be my personal hero, well-respected and distinguished Gartner analyst. "Social media offers tempting opportunities to interact with employees, business partners, customers, prospects and a whole host of anonymous participants on the social Web," said the analyst and vice-president recently, "However, those who participate in social media need guidance from their employer about the rules, responsibilities, ‘norms’ and behaviors expected of them, and these topics are commonly covered in the social media policy."
Gartner has identified seven critical questions that designers of social media policy must ask themselves:
What Is Our Organization’s Strategy for Social Media?
There are many possible purposes for social media. It can be used for five levels of increasingly involved interaction (ranging from monitoring to co-creation) and across four different constituencies (employees, business partners, customers and prospects, and the social Web). It is critical that social media leaders determine the purpose of their initiatives before they deploy them and that those responsible for social media initiatives articulate how the organization’s mission, strategy, values and desired outcomes inform and impact on these initiatives. A social media strategy plan is one means of conveying this information.
Who Will Write and Revise the Policy?
Some organizations assign policy writing to the CIO, others have decided it’s the general counsel’s job, while in other cases, a self-appointed committee decides to craft a policy. It’s useful to gain agreement about who is responsible, accountable, consulted and involved before beginning work on the policy and, where possible, a cross-section of the company’s population should be involved in the policy creation process. It’s important to remember that there is a difference between policy — which states do’s and don’ts at a high level — and operational processes, such as recruitment or customer support — which may use social media. These operational processes need to be flexible and changeable and adhere to the policy, but each department/activity will need to work out specific governance and process guidelines.
How Will We Vet the Policy?
Getting broad feedback on the policy serves two purposes. First, it ensures that multiple disparate interests such as legal, security, privacy and corporate branding, have been adequately addressed and that the policy is balanced. Second, it increases the amount of buy-in when a diverse group of people is asked to review and comment on the policy draft. This means that the process by which the policy will be reviewed and discussed, along with the feedback, will be incorporated into the final copy. A vetting process that includes social media makes it more likely that this will occur.
How Will We Inform Employees About Their Responsibilities?
Some organizations confuse policy creation with policy communication. A policy should be well-written and comprehensive, but it is unlikely that the policy alone will be all that is needed to instruct employees about their responsibilities for social media. A well-designed communication plan, backed up by a training program, helps to make the policy come to life so that employees understand not just what the policy says, but how it impacts on them. It also explains what the organization expects to gain from its participation in social media, which should influence employees in their social media interactions.
Who Will Be Responsible for Monitoring Social Media Employee Activities?
Once the strategy has been set, the rules have been established and the rationale for them explained, who will ensure that they are followed? Who will watch to make sure the organization is getting the desired benefit from social media? A well-designed training and awareness program will help with this, but managers and the organization’s leader for social media also need to pay attention. Managers need to understand policy and assumptions and how to spot inappropriate activity, but their role is to be more of a guide to support team self-moderation, rather than employ a top-down, monitor-and-control approach.
How Will We Train Managers to Coach Employees on Social Media Use?
Some managers will have no problem supporting their employees as they navigate a myriad of social media sites. Others may have more trouble helping employees figure out the best approach for blogs, microblogs and social networking. There needs to be a plan for how the organization will give managers the skills needed to confront and counsel employees on this sensitive subject.
How Will We Use Missteps to Refine Our Policy and Training?
As with any new communications medium, some initiatives go exceptionally well, while others run adrift or even sink. Organizations that approach social media using an organized and planned approach, consistent with the organization’s mission, strategy and values, will be able to review how well these initiatives meet their objectives and use that insight to improve existing efforts or plan future projects better.
More information is available in the report "Answer Seven Critical Questions Before You Write Your Social Media Policy," which can be found on the Gartner website at http://www.gartner.com/resId=1522014.
In addition, I wanted to add the following points:
I am all about the process – And a process for establishing a social media strategy (internal or externally facing) have several process steps which flow sequentially for the varying audience members who will consume or provide this information.
First, It is important to understand your corporate strategic goals. And even if social media isn’t explicitly defined, it is certainly an input to several common objectives like acquire/retain new/existing customers (Marketing), World-Class operations (real-time fodder is a great tool for customer service complaints in real time), etc.
Second, you need to functionally understand the impact domains and what purpose a social strategy will provide: which groups will be impacted by a social media strategy, and what, if anything are they already doing to address? Characteristics of a good purpose according to Carol Rozwell:
1. Magnetic
2. Aligned
3. Properly-scoped
4. Promotes Evolution
5. Low risk
6. Measurable
7. Community-driven
Third, connecting the corporate goals from the strategic plans to the social media purpose / strategy is key – that is what is defined by Aligned and Properly Scoped. All strategic plans evolve over time so why wouldn’t your social purpose evolve as well?
Fourth, Measurement. This is near and dear to my heart : Measuring what matters; business intelligence tools are starting to realize the value of offering real-time capabilities to track the chatter across the social sphere; think about my Wynn Hotel examples from previous posts to validate the power this can provide towards improving customer experience, and ultimately affecting long-term retention of your customers.
Community-driven is self-explanatory. You cannot tell a customer what their voice should be, it is what it is.
You as an organization need to understand that word of mouth from your customers is worth its weight in gold; more than the millions spent on advertising budgets and huge marketing campaigns. Communities offer the soap box that so many customers want to stand upon to share their experiences.
You reap the benefits of understanding this voice, and consuming this information in a meaningful and metrics driven approach that can provide context to your strategic goals without augmenting them with cost laden initiatives or proposals.
“LAURA” Stratification: Best Practice for Implementing ‘Social Intelligence’
Doing an assessment for how and where to learn social media to better understand your business drivers can be daunting, especially when you want to overlay how those drivers affect your goals, customers, suppliers, employees, partners…you name it.
I came up with this process which happens to mimic my name (shameless self-persona plug) to ease the assessment process while providing a guided assessment plan.
First, ‘Learn’ to Listen: learning from the voice of the customer/supplier/partner is an extremely effective way to understand how well you are doing retaining, acquiring or losing your relationships with those who you rely on to operate your business.
Second, Analyze what matters, ignore or shelve (for later) what doesn’t; data should be actionable, (metrics in your control to address), reporting key performance indicators that are tied to corporate strategies and goals to ensure relevancy.
Third, Understand your constituent groups; it isn’t just your customers, but also your shareholders, employees, partners, and suppliers who can make or break a business through word of mouth and social networking.
Fourth, Relate your root causes to your constituents value perceptions, loyalty drivers and needs to ensure relevancy flow through from step 2. Map these to your business initiatives and goals exercise from step 2. Explore gaps between initiatives, value perceptions, loyalty drivers and corporate goals.
Lastly, create Action plans to address the gaps discovered in Step 4. If you analyzed truly actionable data in step 2, this should be easy to do.
To apply this to social media in order to turn it into social intelligence, you need to make the chatter of the networks meaningful and actionable.
To do this, think about this example:
A person tweets a desire to stop using a hotel chain because of a bad experience. In marketing, this is known as an “intent to churn” event; when social intelligence reporting systems ferrets out this intent based on scouring the web commentaries of social networks, an alert can be automatically forwarded to your customer loyalty, marketing/social media or customer response teams to respond, address and retain said customer.
A posting might say “trouble with product or service” – That type of message can be sent to customer operations (service) or warranty service departments as a mobile alert.
And a “having trouble replenishing item; out of stock” question on a customer forum can be passed along to your supply chain or retail teams — all automatically.
The Wynn has a great feedback loop using social media to alert them in real-time of customers who are dissatisfied with their stay who Tweet or comment about this during their stay.
The hotel manager and response time will find this person to address and rectify the situation before they check out. And before long, the negative tweet or post is replaced by an even more positive response, and best of all, WORD of MOUTH to friends and family.
Its sad to say, in this day and age, we are often left without a voice or one that is heard by our providers of services / products. When good service comes, we are so starved that we rejoice about it to the would. And why not? That is how good companies excel and excellent companies hit the echelon of amazing companies!
‘Social Intelligence’, the bridge between social networking and business intelligence, Starts To Build Momentum
Several years ago (in early 2009), I blogged about two of my passions, social networking and business intelligence. It was about the time that business folks starting building their profiles on LinkedIn, extending their networks via Twitter and started realizing that FaceBook wasn’t just a tool for their children to build their socialization skills but was a vehicle for networking with other professionals within and outside of their own personal networks. Grasping the power of the social network was still this abstruse almost arcane concept in its theoretical potential for corporate America. And while there were those visionaries, like the Wynn in Las Vegas, about whom I shared an anecdote within my TDWI presentation on Social Intelligence (one I will share in a moment) later that year, most companies saw social networking websites as distractions and often, banned them from use during the work day.
Why was Wynn different?
As a frequent corporate traveler, I have had many “check-in” line experiences: from the car rental counter to the hotel check-in line, I have had both good and bad experiences. On one somewhat lackluster experience, I was standing in line to check into the Wynn Hotel in Vegas. Several people ahead of me was a gentleman, fairly polished but obviously frustrated by his conversation with the desk clerk. As a highly perceptive observer (or at least, that is how I am spinning being nosy), I listened in on the situation. This gentleman had reserved a junior suite, since he and a colleague were sharing the room, a common occurrence as companies started to tighten their belts around corporate travel expenses. And, the suite was not available. The clerk seemed to want to help but was strapped by her computer system telling her no suites were available until the following night in the category booked. It turns out, she was new.
Quite gruffly, this gentlemen left the line, and proceeded to stand in the lobby, talking to his colleague about the disappointment, and commented that he was going to Tweet (post a message to his Twitter account) that buyer beware when it came to staying at the Wynn. Now, in a city like Las Vegas where capacity can exceed occupancy rates, combined with a name like the Wynn, combined with the sheer reach of a site like Twitter, this kind of negative word of mouth can really hurt a vendor. And more often than not, comments like this are over looked, or at least, were overlooked in the past, because of the lack of technology or reporting to alert such vendors to such disturbances in real time. In a travel situation, do you want to know that your issue was addressed after your trip with a gift and apology in the form of a coupon for choosing the stay there in future?
No…In fact, the breakage rate on such post-trip coupons is 70-80% (remember, I used to work for the largest online travel consortium) :). Thus, granting coupons is ineffective at winning the customer back. And it is because your trip, whether for business or pleasure, was ruined. And no, I am not being dramatic. You might not think a rooming issue can ruin a trip but it can. In fact, just being placed on the wrong floor or near an elevator or merely any event that is different that you were expecting can ruin a trip from a customer’s perspective.
But, I digress…
Back to my story: As soon as the customer finished posting his Tweet to Twitter, he turned to his colleague and walked to a cafe and sat down to order some refreshments. By the time I reached the front of the check in line, I noticed what appeared to be someone who appeared to be in charge (dark suit, name plate, piece of paper in his hand) approach the gentlemen and start a dialogue with him. Within moments, the two shook hands and the paper (which turned out to be room keys and an invoice) were swapped and the authority figure left about his business.
Intrigued, I walked up and asked the gentlemen what had happened. He was so excited by what had happened that he asked me to wait while he posted a note to Twitter. Since I had heard the original part of the story, I started to deduce what was happening. When he was finished, he said that gentleman was the hotel manager. He had been alerted to the room situation via a Twitter application which alerted management to travel disruptions as they occurred in real time to his smart phone. It was his job to make sure the customers were found in the hotel and the situation fixed to the betterment of the customer, no matter the situation. In this case, the customer was treated to an upgraded full suite, which was available, at no additional cost and given vouchers for the show that evening. The customer was so pleased, he had to go back to Twitter to recant his previous post, and to alert people to how well the situation was handled not days after the fact, but within the hour of it occurring.
I was floored.
You hear about the concept of the customer feedback loop but rarely do you see it implemented well or in a way that can affect overall customer loyalty or perception of the brand. In this case, it not only affected the customer and his colleague, but his entire social network.
Later, I found that same manager and asked his what he used to alert him to the Twitter incident from earlier.
He smiled and said we are in the business of pleasure, thus, it is our job to know when we fail. Alerting in real time is not as hard as you think with the right tools and technology. And left it at that.
Ok, so Vegas is a pretty secretive world of proprietary tools and technology, and are often market leaders when it comes to adoption.
And that is where Social Intelligence comes in: the ability to understand the Voice of the Customer as expressed within the intricate web of the social network via tools and technology. What better tools for alerting and reporting on incidents in real-time than those offered by the Business Intelligence suite of tools (at its most generalized state).
I am so happy to also report that in 2011, BI technology is taking an even larger footprint into the Social Intelligence space. When I can say more, I will. Just know I am really excited about the future ahead of us folks!
Happy New Year readers.
50 Ways to Drive Traffic Online
I wanted to share with you this great article I came across – It walks you through the 50 ways to increase online traffic; I would add that if you are interested in building your own personal brand, or the “Brand YOU”, then this article is a must read:
http://www.gathersuccess.com/blogging-tips/50-ways-to-drive-traffic-online
Personal Peer-Production & Shameless Self Plugs
Applying the Bing Decision-Engine Model to “Business Intelligence” and Other Musings
Yes, folks, I am back. Wait, didn’t I write that before.
Well, after having my 1st child, I spent many months (just shy of 10, to be exact), noodling business intelligence, and the concepts I had previously discussed on my blog. For the last 5 years, I have been touting the need for better search integration, offering up the BI mashup concept before people really understood what a plain vanilla dashboard was, and was met by glazed stares and confusion. Now that folks are catching on to the iGoogle experience, and the ability to “mashup” or integrated several points of interest or relevance into a dashboard, I want to discuss this topic again. But, this time, I want to apply the concept of the Decision Engine instead of just the Search Engine when it comes to ways to make BI content more meaningful, more relevant and more useful to end users.
Side note: “mashup” is still not a recognized word in the spell-check driven dictionary lists for the greater population of enterprise applications.
Coupled with my mashup passion was my belief in eye-tracking studies. Eye-tracking measures the human behavior of looking at something and measuring the concentration of the eyes on a particular area of a particular object of interest, say a website for example. In the case of business intelligence, I applied eye-tracking studies to the efficacy of dashboard design in order to better understand the areas where the human brain focused concentration vs. those ignored (despite what the person might say was of interest to them).
Advertisers have known about eye-tracking studies for years, and have applied the results to their business. For example, the eyes will focus on the top left corner first. Whether a TV screen, a book, a piece of paper or a dashboard. It is the area of the greatest concentration. Therefore, special importance has been paid to the piece of advertising real estate. And since the popularity rise of folks like Stephan Few of recent or Edward Tufte, whose design principles for effective dashboard design have driven many a BI practitioner to rethink the look and feel of what they are designing, this concept of top left is more important has become commonplace.
And, the handful of other book grade principles have risen to the surface too: less is more when it comes to color, overuse of lines in graphs is distracting, save pie for desert (pie charts, that is), etc. But tying it all together is another story all together. Understanding how human perception, visual perception and dashboard design meet is a whole other can of worms, and usually requires a specialized skill set to fully “grok” (sorry, but I love Heinlein’s work). 🙂
Excuse my digression…
Take a look at this image which shows eyetracking results from the three most popular search engines in 2006:

Notice the dispersion of color measured in the Yahoo and MSN examples vs. Google. This is correlated to the relevancy of the results and content presented on the page. And 4 years ago, Google’s search engine was a popular go-to tool for many when it came to finding related websites to help answer questions. Fast forward 4 years, and MSN is now Bing, and what was the search engine is now the dubbed “decision engine.”
The advent of the decision-engine in my eyes is because of the dilution of search engine effectiveness based on the flood of results presented to end users. In fact, I am sure the results of an eye tracking study from 2010 would be vastly different as a result of the exponential growth of web-based content available for crawling.
The same has occurred within enterprise business-intelligence platforms. What was introduced as powerful has really become inundated with content, in the form of reports, objects, dimensions, attributes, attribute elements, actual metrics, derived metrics and the list goes on and on.
Superficially, search was introduced as an add-on to the enterprise BI platforms. An add-on; really, an afterthought.
To the credit of the solutions on the market (grouped into a collective unit), people didn’t realize what they didn’t or better put, needed to know when building the technology behind their solution offerings. And they needed to start somewhere. It was only after BI became more mass-adopted in corporate America, and the need grew pervasive into even the smallest Mom and Pop shop for some level of reporting, that people began to realize that getting the visualizing the data was one thing; finding the results of those visualizations or data extractions was an entirely different can of worms.
At the same time as this was happening, the search giants started innovating and introducing the world to the concepts of real-time search and the “decision engine” named Bing. Understanding the statistical models behind how search algorithms work, even simplistically, understanding enough to be dangerous, is a key that any reader of this blog and any BI practitioner would be smart to invest their own time into doing.
In a nutshell, my belief? Applying those principles and eons of dollars thrown at optimizing said models (by the search giants) is an effective way for BI solutions at any level to leverage the work done to advance search research and technology, instead of just patching BI platforms with ineffective search add-ons. Just look back at the Golden Triangle study graphic above, and remember that long before BI design experts like Tufte and Few said it, advertising gurus knew that the Top Left real estate of any space is the most important space to reach end users. So, instead of thinking of search as a nice add-on for your BI platforms, why not see it as a necessity. if a report is loaded into a repository and no one knows about it, was it ever really done? Let alone meaningful or valuable enough to be adopted by your end users? Think about it…
Technorati Tags: design,"business intelligence",Tufte,Few,"decision engine",Google,Bing,"search engine",algorithm,"eye-tracking",dashboard
43 Things Tags: design,"business intelligence","BI",Bing,Google,Tufte,Few,"Decision Engine",algorithm,"eye-tracking",dashboard,KPI
del.icio.us Tags: design,business intelligence,Bing,BI,"business intelligence,Google,algorithm,dashboard,"eye-tracking",Tufte,Few
TDWI NW Chapter Summer Social Event: Warehousing Over Wine

http://twtvite.com/badge/?twt=TDWI_WarehousingOverWine
Come out to the TDWI NW Chapter Summer Social event on Tuesday, July 27, 2010 at 5:30 – 8:00 PM at the Goose Ridge Tasting Room – TDWI members, non members, BI and DW enthusiasts, or those just interested in meeting new people – Come one, come all!
Gartner 2010 Business Intelligence Tools Magic Quadrant
For those of you who prefer not to register to receive this information, here is the 2010 Gartner Magic Quadrant rating the latest and greatest BI Platforms.

I love how many of the pure play newbies of last season like QlikTech moved from visionaries into the challengers role giving the big dogs on campus, MS, SAP/Business Objects and Oracle a run for their money. And while, value can be shown easily using a product which can consume and spit out dashboards as easily as making scrambled eggs in the morning, one has to wonder how much value it provides over time when the data to support such dashboards often still requires much manual intervention, ie. acquisition from source systems, cleansing, transformation and loading into a consumable format. Where’s the ROI in that? Most systems boast on the time savings achieved with implementation when calculating a BI system’s ROI.
But, not to knock them. I find them a great alternative for proof of concept work or when the manual nature of compiling the data isnt a concern or is someone’s role, and all that is needed is the icing to tell the cunning story (“Once upon a time, there was a SKU…And this SKU had many family members who lived in different houses in different regions of the world”)
Aah yes, if only all BI could be told as such a happy little anecdote of a story…A girl can wish can’t she?
Download Gartner 2010 Report Click Here
Report is also available in my SkyDrive library.
Anyone Else Notice the Over Usage of the Word ‘Dashboard’ / Lack of Principled Designs on the Web today ?
Doing a key-word search tonight using a variation of ‘dashboard, casino, marketing’ examples yielded two pages of the same link and a mix of other commentary type blogs. Granted, I am a blogger and find much value in the opinions of others. But, disenchantment quickly set in. It’s easy to comment on the designs of others. Crafting strategic KPIs in a way that can easily cascade down into tactical management dashboards and ultimately, down into operational reports in order to appeal to the broad audience of C-levels, middle managers and individual contributors is challenging. The data model and underlying ETL processes, the storage mechanisms, the network capacity, even the power of your box (both physical and virtually, speaking) can plague a dashboard’s performance. But what about design?
I am a huge fan of Stephen Few, having sat in several all day classes as well as assisting in coordinating his presence at a local TDWI NW Chapter as keynote speaker. His principles are simple to understand and visually, appeal to the broad and hidden nature of our visual cortex’ response to stimuli – What?
Our brains play a key part of the adoption of dashboards; plain and simple. The better designs in the world take into account everything from eye tracking on a screen, to real estate / importance placement of items on the screen, to color response cues (red – stop; green – go) and more importantly, our innate ability to shut down response when we are inundated with color / graphics / text / information. While everyone has stepped onto the bus and started down Dashboard Drive, I have to wonder when and where this road will stop, and the next latest and greatest will move into it’s place. Beware, oh reader; don’t be swayed by the flash and glitz of the sales presentation. Oh yeah, and, be wowed by sparklines and bullet graphs (here: http://www.perceptualedge.com/blog/?p=50) and their ability to relay trend, target, actuals in a simple line graph or horizontal bar chart using varying grey tones and a hint of red, without adding traffic lights or gauges (the bains of my existence, friends will the ill fated over-used pie chart).
Balanced Scorecard Collaborative Annual Performance Management Summit 2010 – Presenter Experience
Sorry for my delay. Much of my energy these days is going into the productization of my consulting experience around building dashboards and scorecards that are linked through common, meaningful KPIs (key performance indicators) along vertical channels. It always surprises me which industries seemingly, from an outside PoV, would have cunning measurement tools in place from those that would not. Why? I am often wrong in my presumptions. I think profitable company means some extraneous $$ available to invest in BI or other data visualizations, because, naturally, it is where I would invest it if I were Company X’s CEO. 🙂 RIGHT! This is not the typical use case. Even in industries who fall into the highly regulated / compliance driven field still use spreadsheets or Access dbs (or as Wayne E. calls them, spreadmarts) to house/compile/report their data. Tomorrow, May 12, I am speaking at the annual BSCol Performance Management summit on designing closed feedback loop systems to address scorecard events and was reminded, dear readers, that we have come a long way since I started this blog many years ago, but have a long way to go before companies and ourselves, frankly, fully grasp the best ways to incite leaders with excitement and understanding about how to drive business initiatives and strategic objectives meaningfully instead of instinctually, where middle managers and line workers will have their contribution to those objectives linked or cascaded down into; where reporting and dashboarding tools will offer simplicity and ease of use developing the supporting data model to facilitate such drill downs, an often overlooked requirement when building scorecards or dashboards that "drill-down" into reports with that fine layer of granularity; where the same platform has the ability to run complex statistical modeling techniques using the same datasets and where data visualizations become more than the latest Flash based dashboard that often carries more sex appeal during demo that one can ever extract from it post-acquisition. Aah yes, those days will be nice. One day, I believe it will happen. A girl can dream, right…?

Data Visualization: Looking vs. Seeing
For many years vision researchers have been investigating how humans use theiw own visual cortex and other perceptions based systems to analyze images. An important initial result was the discovery of a very small subset of visual properties detectable very quickly & for a large part, very accurately, by the lowest of these systems, aptly referred to as low-level visual system.
These properties were initially called “preattentive”, since their detection seemed to come before one actually focused their attention.
Since then, we have a better understand. As it stands today, attention plays a critical role in what we see, even at this early stage of vision. The term preattentive continues to be used, however, since it conveys the speed and ease of visual identification of these properties.
Anne Treisman determined two types of visual search tasks: 1 which is preattentive known as Feature search, and the other which requires conscious attention or Conjunction search. Feature search can be performed fast and pre-attentively for targets defined by primitive features.
The features or properties can be broken into 3 areas: color, orientation and intensity.
And as you might have guessed, Conjunction search is slower and requires the participant’s full attention, something we humans have a hard time giving in certain situations, which is only worsening with the advent of hand held devices and other mobile smart phones to distract us.
“Typically, tasks that can be performed on large multi-element displays in less than 200 to 250 milliseconds (msec) are considered preattentive. Eye movements take at least 200 msec to initiate, and random locations of the elements in the display ensure that attention cannot be prefocused on any particular location, yet viewers report that these tasks can be completed with very little effort. This suggests that certain information in the display is processed in parallel by the low-level visual system.” (“Perception in Visualization by Christopher Healey”)
What does this mean: well, given a target, say a red circle, and distractors being everything else, which is this case are blue objects,one can quickly see in this example which is which, i.e. in < 200 msec, you can glance at these two pictures and define the target from the distractors, right?

 As in this example, it seems introducing preattentive cognition to dashboards would result in a healthy and loving relationship and one when carried over time (ie – employed by BI practitioners during design phase of any BI / data visualization project) would result in more meaningful, & less cluttered dashboards, right?
Now, think about your dashboards and BI visualizations – Think about how many of them tell a good and clean story, where the absolute most important information “pops” out to end viewer. One requiring little explanatory text, contextual help or other mechanisms we BI practitioners employ to explain our poorly designed dashboards. And, I am by no means claiming everything I have designed to be fault free– We all learn as we go. But I can say that those designs of today vs. yesterday are better because of my understanding of visual perception, neural processing / substrates and cognitive sciences and how to apply these fields to business intelligence in order to drive better data visualizations.
Why is it that some who work in BI think the more gauges or widgets pushed into a screen, the better?
Instead, I contend that the application of this principle to dashboard design, report design, website design or any type of design would point out that much in our world today is poorly designed, fitting with non complementary colors, over use of of dristractor objects, thus, rendering the user confused or “distracted” from the target object, which could be something as important as revenue of a company, or number of death in an ER wing of a hospital, both of which so important as one might question how such numbers could get lost.
Try it for yourself by reading anything by Stephen Few or Edward Tufte as a starting place.
SPModule and Sharepoint 2010; the power of the PowerShell
Check out my Google sidewiki post here: http://www.google.com/sidewiki/entry/flowergirldujour/id/Swp7WYEPjDdbMeaYQkPn8Hir4MY
And definitely download this module so that you can use SPModule…
Here is what the interface looks like:

From Zach Rosenfield’s blog, who is the Sharepoint Program Manager at Microsoft:
Welcome to the introduction of SPModule. SPModule is a Windows PowerShell module written by members of the SharePoint Product Group in our spare time. SPModule is an example of how we would envision you accomplish various common tasks within Windows PowerShell in a SharePoint 2010 environment. We hope to position various best practices from these scripts and we hope in the long term to reference these also within technet. These blog posts serve simply as our first location of sharing them, and this post will be updated once we have the samples hosted within technet. The scripts themselves are not officially supported, but we will entertain questions and suggestions through this blog until we get it onto technet.
How do I get started?
First download the zip that contains the scripts from here:
http://sharepoint.microsoft.com/blogs/zach/Script%20Library/Modules/SPModule/SPModule.zip
Next, unpack the zip file onto a share in your environment. Before you get to use the scripts, you’ll need to make a decision around signing. By default, Windows PowerShell is configured securely such that it will not run unsigned scripts. You can choose to either sign them yourself with a self-signed certificate or run Windows PowerShell in a mode where you do not verify signatures. We do not recommend running Windows PowerShell in this state. However if you are in an isolated environment, you may choose to do so. If you follow my last post about signing files, you can use those instructions to sign the entire “Module” in a single command:
function Add-Signing($file){ Set-AuthenticodeSignature $file @(Get-ChildItem cert:\CurrentUser\My -codesigning)[0] }
ls -r -Include ("*.ps1","*.psd1","*.psm1") |%{ Add-Signing $_ }
Please note that if you have not installed SharePoint, then you need to lower the Execution Policy to “AllSigned” using this command: Set-ExecutionPolicy AllSigned. This is done by installing the SharePoint bits so if you’ve already installed this is not needed.
Then open Windows PowerShell as an administrator (right click on the link and select “Run as administrator”). If you already have SharePoint 2010 installed, you could use the SharePoint 2010 Management Shell instead. Once the window opens, the first thing we need to do is add the path to the module to your Windows PowerShell module path (presuming you created a folder called “SPModule” on your server):
$env:PSModulePath = “C:\SPModule;” + $env:PSModulePath
Next we need to import the modules:
Import-Module SPModule.misc
Import-Module SPModule.setup
When you import the SPModule.misc module, you will invoke a update check. In 1.0, this will check a file in the script library above to see if there is a newer version available. If you are notified that there is, you can go to that location and download the newer version. Once the Import-Module commands are done, you’re ready to use SPModule.
So, what does SPModule give me?
The 1.0 version of SPModule provides a few major new commands and a number of smaller supporting commands. Here’s how you can get the list of commands in the module:
Get-Command –Module SPModule.*
The major commands of 1.0 are Install-SharePoint, New-SharePointFarm, Join-SharePointFarm, and Backup-Logs. They do exactly what their names would lead you to expect (Backup-Logs collects all the logs on the local machine not the whole farm). The rest are for more advanced scenarios or are used by these larger functions—please be careful using commands you don’t understand Here’s some quick examples to get you started:
Install SharePoint Bits (including Prereqs) on a
Install-SharePoint -SetupExePath “\\servername\SharePoint2010-Beta\setup.exe” -PIDKey “PKXTJ-DCM9D-6MM3V-G86P8-MJ8CY”
New-SharePointFarm –DatabaseAccessAccount (Get-Credential DOMAIN\username) –DatabaseServer “SQL01” –FarmName “TestFarm”
Join-SharePointFarm -DatabaseServer “SQL01” -ConfigurationDatabaseName “TestFarm_SharePoint_Configuration_Database”
Backup-Logs -outp “$env:userprofile\Desktop\SharePointLogs.zip”
Note: Backup-Logs may have trouble putting the subzip files into the final zip. We are aware of this issue and are working on this for the next release. For now, we will detect the situation and keep the subzip files that had a problem”
Talking about Bayesian inference, Data Visualization and More
Quote
what is your take on using Bayesian inference to determine website behaviors of consumers of your goods and services? And once established, and quantifiable metrics gleaned on actual behaviors, do you go back and adjust your hypothesis with more objective data? Most do not, so don’t fault yourself. If you even tried to apply statistical methods to “gut feel” hypothesizes, hats off to you!
The power within this model can also be extended to visualizing your statistical models as well.
Check out what Twitter users were ‘tweeting’ about during the Super Bowl as visualized by the NY Times:
Talking about Getting Started \ Processing 1.0
Quote
Getting Started \ Processing 1.0
Gotta ask my audience for commentary on this one…How many of you are using Processing 1.0 environment/language to build your complex data visualizations?
Processing.org quotes it as "Processing is a simple programming environment that was created to make it easier to develop visually oriented applications with an emphasis on animation and providing users with instant feedback through interaction." (http://processing.org/learning/gettingstarted/)
I have been using this app since college and being a BI professional services/developer now, I tend to overlook the simplicity and ease of use of the Processing language, functions and environment (PDE).
Has anyone else used it for building data visualizing?
Does Google SideWiki rock? Let’s find out…
I posted a wiki to my company’s home page (http://www.google.com/sidewiki/entry/100318308419716752076/id/bjzCPgiw49UzmckRuIiLBRtmh4Y ) as a test of Google SideWiki – An avid fan of the Google app suite (though still an Apple girl at heart) , I thought I would try SideWIki today. Let’s see how well it links my social networks together from a SEO perspective. As we all know in the "social intelligence" space, linking up social profiles is the "FREE" way to get higher search engine traction between our profiles and our social network pages/spaces.
Scorecard KPI Collection Form Template – Google Docs
Use this to help you collect your KPIs, Objectives and Perspectives all in a cascaded modular approach…Free template on Google Docs for you to use!
Edit form – [Scorecard KPI Collection Form] – Google Docs
Loading…
Respect Paid to Pitney Bowes – How PBBI Turned This Blogger’s Opinion Around
I posted the Gartner Magic Quadrant last week (Gartner Magic Quadrant for Data Integration – Delta Comparing 2007-2009) and commented my opinion on the choices for winners and losers (big surprise, but really, I was shocked).
For one, BI practitioners tend to believe they are experts at their domain, and rightfully so, if they are good at what they do and have been doing it for a few years. In my case, 11 years of my life have been spent learning, upgrading, relearning and immersing myself in business intelligence tools and platforms.
So, this year, I was surprised by their ETL quadrant because of Pitney Bowes – Here is my comment:
[Laura Edell comment] Ummm, I thought Pitney Bowes provided corporations with stamps and other business-related supplies…How does one leap from that genre to not just business intelligence, but data integration…? Maybe to compete with the former Business Objects Data Quality Zip Code Cleanser? j/k – but I thought that was eye catching enough to call out.
A little while later, I was most surprised to receive an email from Pitney Bowes’ VP of Communication following up on my comment in a most professional manner. He also offered to chat further about their PBBI solution and walk me through the history and evolution of the PBBI product stack:
Here is a list of ETL / BI related links from the Pitney Bowes site @ http://pbinsight.com/solutions/by-business-need
![]()
Improve Operational Efficiency
Automated Address Management for Improving Operational Efficiency
- Business Intelligence
- Customer Communications
- Data Enrichment
- Data Governance
- Data Integration & Extract, Transform, and Load
- Data Profiling
- Data Quality
- Data Transformation
Kudos, Pitney Bowes! I stand corrected!
Troubleshooting Apple Permissions Issue: MacBook Pro OS X 10.5.8 Grey Screen Spawned This Posting (again)
Thought this support article from Apple’s KnowledgeBase website was really helpful and wanted to share…
Troubleshooting permissions issues in Mac OS X
Content from article:
Summary
Learn about the concept of permissions (or "privileges") in Mac OS X, issues that can arise due to incorrect permissions settings, and how to troubleshoot them.
Products Affected
Mac OS installation/setup (any version)
Using the Repair Privileges Utility
Most users of Mac OS X have not intentionally modified privileges and simply need a utility to reset system privileges to their correct default values. If you have Mac OS X 10.2 and later, this utility is included in the operating system. If you have Mac OS X 10.1 you can download it. For versions 10.0 to 10.1.4, you must update to version 10.1.5 first.
For Mac OS X 10.2 or later, open Disk Utility (/Applications/Utilities/). Select your Mac OS X startup volume in the column on the left of the Disk Utility window, then click the First Aid tab. Click the Repair Disk Permissions button. You may see an erroneous message.
If you have modified the contents of the folder /Library/Receipts, the Repair Permissions feature won’t work as expected. Repairing permissions requires receipts for Apple-installed software. Additionally, the utilities only repair Apple-installed software and folders (which does not include users’ home folders).
The remainder of this document contains more advanced information.
Note: In Mac OS X 10.5 and later, while started up ("booted") from the Mac OS X 10.5 installation disc, a user’s home directory permissions can be reset using the Reset Password utility.
Warning: This document describes how you may modify permission settings by entering commands in the Terminal application. Users unfamiliar with Terminal and UNIX-style environments should proceed with caution. The entry of incorrect commands may result in data loss and/or unusable system software. Improper alteration of permissions can result in reduced system security and/or exposure of private data.
Permissions Defined
Mac OS X incorporates a subsystem based on a UNIX-style operating system that uses permissions in the file system. Every file and folder on your hard disk has an associated set of permissions that determines who can read, write to, or execute it. Using the AppleWorks application and one of its documents as an example, this is what the permissions mean:
- Read (r–)
You can open an AppleWorks document if you have the read permission for it. - Write (-w-)
You can save changes to an AppleWorks document if you have the write permission for it. - Execute (–x)
You can open the AppleWorks application if you have the execute permission for it.Also note that you must have execute permission for any folder that you can open; thus File Sharing requires execute permission set for other, world, and everyone for the ~/Public folder, while Web Sharing requires the same setting for the ~/Sites folder.
When you can do all three, you have "rwx" permission. Permissions for a folder behave similarly. With read-only permission to a folder containing documents, you can open and read documents but not save changes or add new documents to the folder. Read-only (r–) permission is common for sharing files with guest access, for example.
Owner, Group, Others
Abbreviations like "rwx" and "r-x" describe the permission for one user or entity. The permissions set for each file or folder defines access for three entities: owner, group, and others.
- Owner – The owner is most often the user who created the file. Almost all files and folders in your home directory will have your username listed as the owner.
- Group – Admin users are members of the groups called "staff" and "admin". The super user "root" is a member of these and several other groups. Non-admin users are members of "staff" only. Typically, all files and folders are assigned to either "staff," "admin," or "wheel".
- Others – Others refers to all other users that are not the owner or part of the group for a file or folder.
Since each entity has its own permission, an example of a complete permission set could look like "-rwxrw-r–". The leading hyphen designates that the item is a file and not a folder. Folder privileges appear with leading "d," such as "drwxrw-r–". The "d" stands for directory, which is what a folder represents. Figure 2, below, depicts how this looks in the Terminal application.
Abbreviating permissions as numerals
After a while, you might think that "-rwxrwxr-x" is a lot to type. And you’d be right. That’s why there’s a simple way to abbreviate permissions as numerals, ranging from 777 (-rwxrwxrwx) down to 000 (no access). An "rwx" becomes a 7, the sum of 1, 2, and 4, where 4=Read, 2=Write, and 1=Execute. A zero means no access. Each of the three numerals is the sum of permissions for Owner, Group, and Other, respectively. Thus our example of "-rwxrwxr-x" becomes 775.
Example: Creating a TextEdit document
Suppose you create a TextEdit document and save it in the Documents folder of your home directory. The document has privileges of "-rw-r–r–", so you can read and write to the file; but the assigned group and any other users can only read it. Because you saved the file in your Documents folder (drwx——), the group and other users cannot even see your file. The enclosing folder’s permissions effectively supersede the file’s own permissions. This is how the home directory structure of Mac OS X provides privacy. If you drag the file to your Public folder (drwxr-xr-x) and log out, another user could log in to the computer and read your public file.
Default settings for new files and folders
Ownership settings
- User is the user that creates the new file or folder.
- Group is default group of the user who created the file or folder.
Permissions
- Folders or directories: drwxr-xr-x
- Files: -rw-r--r--
Root: The "Super User"
In Mac OS X, a super user named "root" is created at time of system installation. The root user has complete access to all files and folders on the computer, as well as additional administrative access that a normal user does not have. In normal day-to-day usage of your computer, you do not need to log in as the root user. In fact, the root user is disabled by default.
Issues Related to Permissions
Incorrect permission settings may cause unexpected behavior. Here are several examples with troubleshooting suggestions:
- Application installers, Applications folder
A third-party application installer incorrectly sets permissions on the files it installs, or even the entire Applications folder. Symptoms of the Application folder’s permissions being set incorrectly include applications appearing in the dock as question marks, and/or not being able to connect to the Internet. It is also possible that software installed while logged in as one user will be inaccessible when logged in as another. To avoid this, make sure you are logged in with your normal user account when installing software that you wish to use with that account.
- Files created in Mac OS 9
Files created in Mac OS 9 may appear in Mac OS X with root ownership. When you start up in Mac OS 9 on a computer that also has Mac OS X installed, you can see, move, and delete all files, giving you the equivalent of root access. For this reason it’s a good idea not to move or open unfamiliar files or folders when started up in Mac OS 9.
- Power interruption
The file system may be affected by a power interruption (improper shutdown) or when it stops responding (a "hang" or "freeze"). This could affect permissions. You may need to use fsck.
- Software access=user access
Most applications executed by a user only have access to the files that the user has access to. Backup software, for example, may not back up Mac OS X system files that have root ownership. - Emptying the Trash
In some circumstances, folders for which you do not have write permission can end up in the Trash; and you will not be able to delete them or the files contained in them. Remember that in Mac OS X there is not a single Trash folder. Instead, each user has a Trash folder in their home directory (named ".Trash"). There is also a Trash folder for the startup volume, and Trash folders for other volumes or disks. When a user throws away a file on a local non-startup volume, the name of the folder on that volume is "/.Trashes/UID", where UID is the user ID number of the user (which may be seen in NetInfo Manager). In either case, all Trash folders are hidden from the user in the Finder. In these situations you can either start up into Mac OS 9 to locate the files and delete them, or you can use the Terminal application. Issues with emptying the Trash are much less likely to occur in Mac OS X 10.2 or later, since the Finder empties the Trash as the root user. However, issues may still occur with files on remote volumes for which your local root user has no special privileges.
Warning: Typographical error or misuse of the "rm -rf" command can result in data loss. Insertion of a space in the wrong place could result in the complete deletion of data on your hard disk, for example. You may wish to copy and paste the commands below into a text editor to verify spacing. Follow these steps to delete Trash for the logged-in user:
- Open the Terminal application.
- Type: sudo rm -rf
Note: Type a space after "-rf". The command does not work without the space. Do not press Return until Step 6. - Open your Trash.
- Choose Select All from the Edit menu.
- Drag all of your Trash into the Terminal window. This causes the Terminal window to automatically fill in the name and location of each item in your Trash.
- Press Return.
All of the items in your Trash are deleted. As an alternative method, you may execute these commands. The second and third commands will delete Trash belonging to other users. The commands are:
Warning: Typographical error or misuse of the "rm -rf" command can result in data loss. Insertion of a space in the wrong place could result in the complete deletion of data on your hard disk, for example. You may wish to copy and paste the commands below into a text editor to verify spacing.
Important: There is no space between "/" and ".Trash" or ".Trashes" below.
sudo rm -rf ~/.Trash/
sudo rm -rf /.Trashes/
sudo rm -rf /Volumes/<volumename>/.Trashes/
Note: To end the sudo session, you should either execute the exit command, or log out of Mac OS X and then log back in.
Respectively, this permanently deletes all files in the current user’s Trash, the startup volume Trash, and the Trash for other volumes (if any). These commands cannot delete locked files. You have to unlock them first.
Note: The sudo command can be used to temporarily obtain super user status and change permissions on files that otherwise could not be changed. However, it is only available if you are logged in with an administrator account, and it requires an administrator account user password for authentication.
How to View and Change Permissions in the Finder’s Info Window
The Mac OS X Finder can be used to inspect and modify permissions settings for some files and folders. You can only change permissions for files and folders of which you are the owner. This can aid in troubleshooting permissions-related issues. To view and change permissions in the Info window, follow these steps:
- Select a file or folder in the Finder.
- From the File menu, choose Show.
- Choose Privileges from the pop-up menu in the Info window.
- Using the pop-up menus, change permissions settings as necessary (Figure 1).
- Optional: If you are changing permissions for a folder and you want the changes to apply to enclosed folders as well, click Apply. Apply only appears when you show info for folders.
Note: Changes made using the Info window take effect as soon as they are made, even before closing the window.

Figure 1 Privileges in the Info window
Viewing and Changing Permissions With Terminal
The Terminal application is located in the Utilities folder in the Applications folder. You can use Terminal to inspect or change permissions. Unlike the Finder’s Info window, the sudo command gives you the convenience of root access without having to log out and back in as root.
Warning: Basic knowledge of the command line is required to utilize this tool. Data loss and/or unusable system software may result if the Terminal application is used improperly.
To determine the permissions settings for files or folders, open Terminal and navigate to the directory where the file or folder is located. Then execute the command "ls -l". The output resembles that in Figure 2.

Figure 2 Viewing permissions with Terminal
In the Figure 2 example, any user can read "File Name1.ext", because the read bit (r) is set for others. But the file is only changeable by root because the write bit ![]() is only enabled for the owner, which is root. If the file is not a system file and you would like to be able to modify it from your normal account, you could change the owner with the following command:
is only enabled for the owner, which is root. If the file is not a system file and you would like to be able to modify it from your normal account, you could change the owner with the following command:
sudo chown yourusername "File Name1.ext"
The file is owned by root, not by the user logged in, so the "sudo" command gives you temporary root access. Replace yourusername with your account’s short name.
Space syntax: Be careful when typing spaces in file paths within the Terminal. In the example, the filename is enclosed in quotation marks because it contains a space. Alternatively, you can replace spaces with a backslash followed by a space. Without the quotation marks, the same command would be typed as:
sudo chown yourusername File\ Name1.ext
For more information on changing ownership, groups, and permissions, see the man (manual) pages for chown, chgrp, and chmod. You access man pages by executing "man <command_name>". For example:
man chmod
By default, man pages are displayed one at a time. To read the next page, press the Space bar. To exit the man page, press Q.
Gartner Magic Quadrant for Data Integration – Delta Comparing 2007-2009
We finally have an open source tool in the Gartner Magic Quadrant (source: Gartner Group) for Data Integration while IBM and Informatica keep a big lead.
Gartner have been modifying the inclusion criteria across most of its magic quadrant –criteria:
-
They must generate at least $20 million of annual software license revenue from data integration tools or maintain at least 300 maintenance-paying customers for their data integration tools.
-
They must support data integration tools customers in at least two of the major geographic regions (North America, Latin America, Europe and Asia/Pacific).
-
They must have customer implementations that reflect the use of the tools at an enterprise (cross-departmental and multiproject) level.
There are not many software vendors out there who are charging as hard at data integration as IBM and Informatica and it shows in the latest quadrant where IBM and Informatica are further in front of the competition.

The diagram on the left shows the moves from 2007 to 2008 and 2009 with the light green line being 2007 to 2008 and the dark green being 2008 to 2009. You can see that IBM made a big move in the 2008 quadrant and has hovered while Informatica have made big moves in each year.
The Losers
There are no real winners and losers, there are just those companies that will give the quadrant away for free, those who will just mention it in a press release and those who will pretend it doesn’t exist. Among those who will pretend it doesn’t exist:
– Sun Microsystems and TIBCO have been dumped from the quadrant because they don’t sell ETL style data integration tools any more. There are a couple purple lines on the diagram from where those vendors used to be.
– ETI and Open Text are in free fall and won’t be staying in the quadrant much longer. ETI are an old school data integration product who never got the hang of the modern trend for visual design interfaces and data integration suites.
– SAP Business Objects are still in the leader quadrant – but only just. Does not bode well for the SAP acquisition of Business Objects.
The Winners
– Obviously Informatica and IBM are the clear winners with Informatica making a big move based on recent acquisitions and releases such as Informatica 9 and the Business Glossary.
– Oracle jump into the leader square and can blow raspberries back at Microsoft.
– Talend are the first open source data integration vendor to get into the quadrant, though they would argue (at great length) that they should have been included last year and the quadrants move too slowly in the fast paced world of business software.
– Syncsort and Pervasive keep plugging away and improving and keeping costs of software beneath those of the market leaders.
[Laura Edell comment] Ummm, I thought Pitney Bowes provided corporations with stamps and other business-related supplies…How does one leap from that genre to not just business intelligence, but data integration…? Maybe to compete with the former Business Objects Data Quality Zip Code Cleanser? j/k – but I thought that was eye catching enough to call out.
